areppim: information, pure and simple
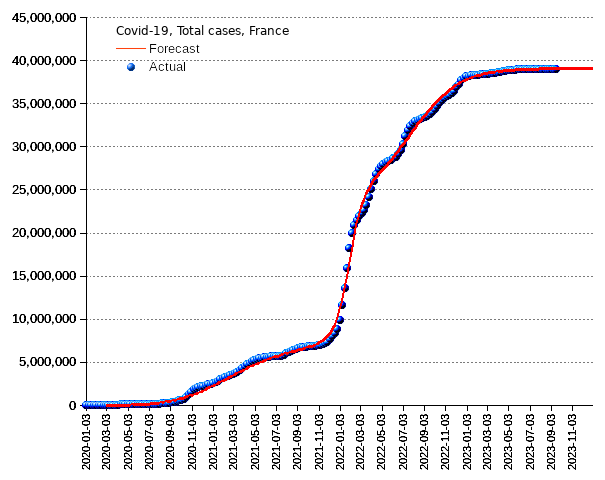
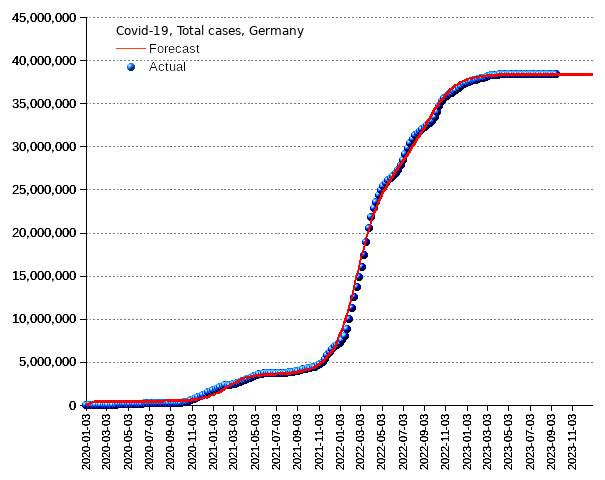
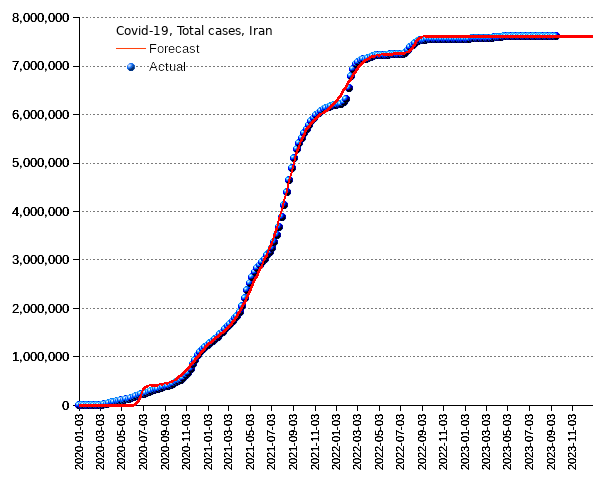
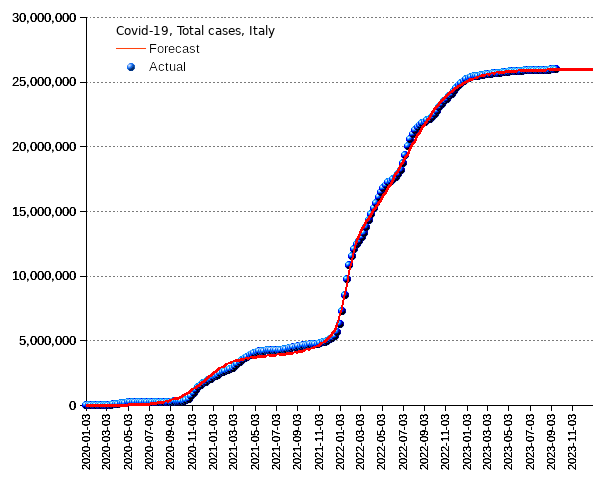
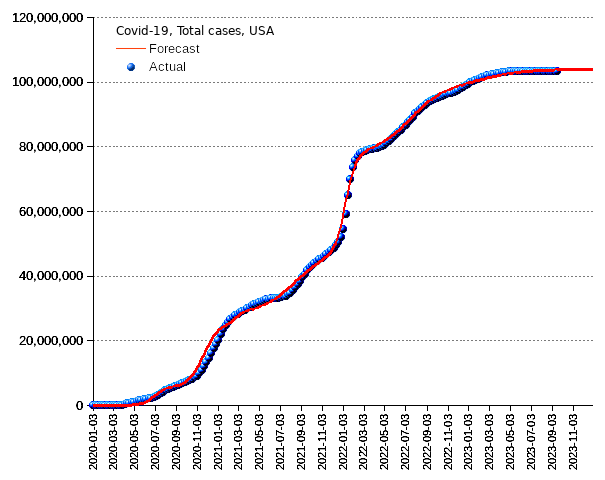
![]() Actual data from WHO (World Health Organization), and areppim S-curve projections for selected countries:
Actual data from WHO (World Health Organization), and areppim S-curve projections for selected countries:
| World total deaths | World total cases | Situation per WHO region | 14-day cumulative notifications | China total cases | France total cases | Germany total cases | Iran total cases | Italy total cases | Portugal total cases | Spain total cases | Switzerland total cases | United Kingdom total cases | United States total cases |

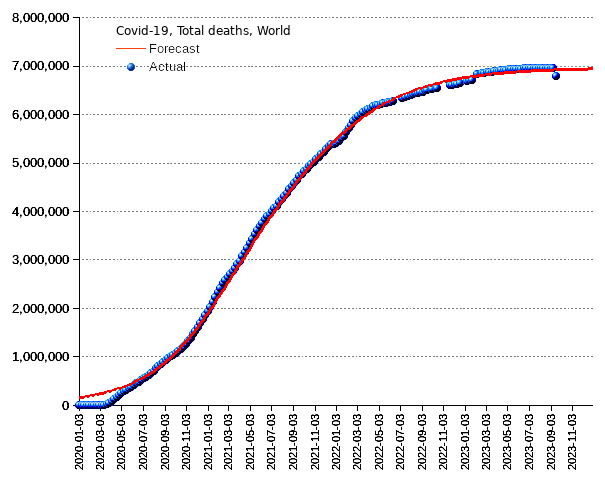
How many fatalities did Covid-19 actually cause? Official WHO data says close to 7 million at the present date. But a recently published WHO study estimates 14.83 million excess deaths globally, 2.74 times more deaths than the 5.42 million reported as due to COVID-19 for the period
2020-2021.
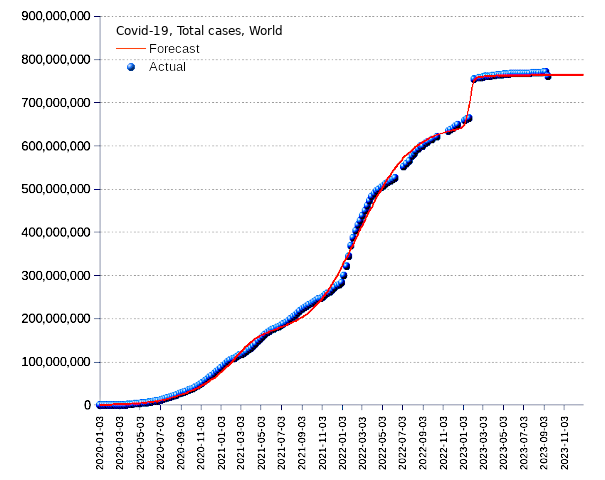
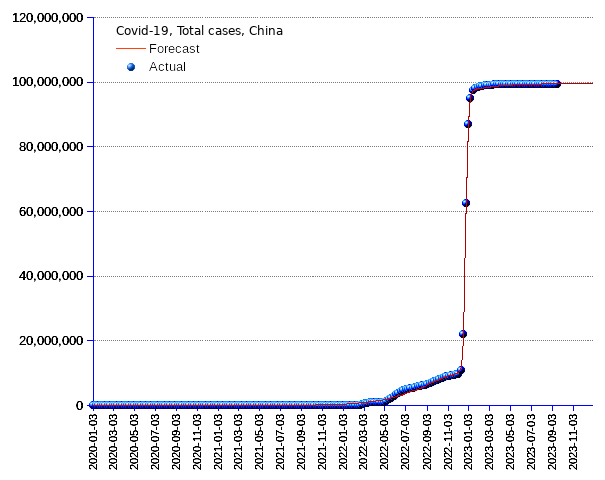
Our projection is obtained by a logistic regression based on the actual numbers provided by ECDC and by WHO. In those cases where significant bumps in the time series suggest a definite change of direction, we fitted the regression curve by means of a multi-logistic function.

| Total cases | Total deaths | Total vaccine doses per 100 population | |||
|---|---|---|---|---|---|
| Region | Nbr | Percent | Nbr | Percent | Nbr |
| Africa | 538,788 | 0.1% | 1,108 | 0.0% | 56.63 |
| Americas | 193,254,876 | 25.4% | 2,959,361 | 43.6% | 208.05 |
| Eastern Mediterranean | 23,390,996 | 3.1% | 351,414 | 5.2% | 123.28 |
| Europe | 276,117,561 | 36.2% | 2,248,538 | 33.1% | 185.18 |
| South-East Asia | 61,204,332 | 8.0% | 806,778 | 11.9% | 165.75 |
| Western Pacific | 207,262,442 | 27.2% | 416,969 | 6.1% | 242.24 |
| Global | 761,769,759 | 100.0% | 6,784,181 | 100.0% | 173.22 |
| Source : WHO Coronavirus (COVID-19) Dashboard retrieved on 20 September 2023. | |||||
Starting from the week of 7 August 2023, the Region of the Americas has stopped sharing the COVID-19 cases and deaths updates, announced the World Health Organization. However, it would be wrong to assume that the Covid scourge has been terminated. In fact, Covid-19 hospitalizations in the USA are rising, fueled by heat and waning protection. Weekly US hospital admissions rose 43% from late June. Occasional bumps in cases likely to continue, experts say.
Furthermore, the World Health Organization on Aug. 9 flagged a new Covid-19 variant that’s spreading quickly and widely. Nicknamed “Eris” and officially designated EG.5, the new offshoot is rapidly gaining ground across the world
In short, albeit the World Health Organization ended the global emergency status for COVID-19 on Friday, 5 May 2023, more than three years after its original declaration, the world did not get rid of the disease yet.

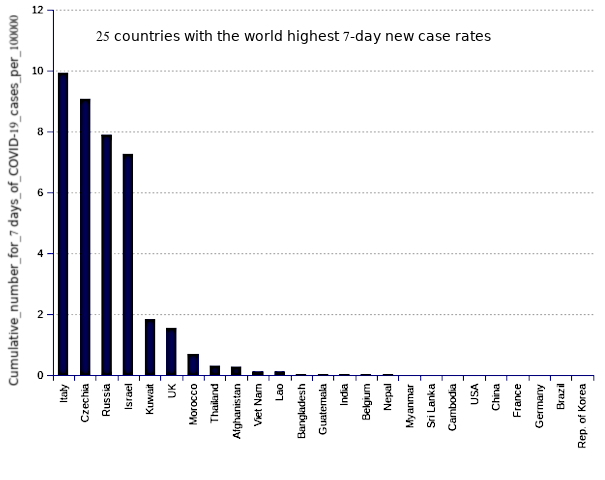






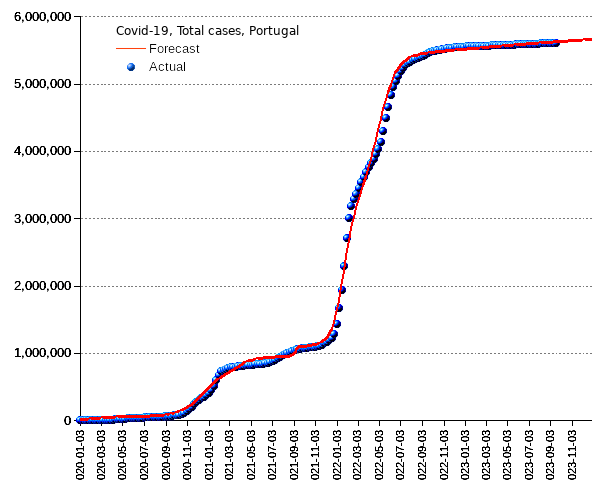

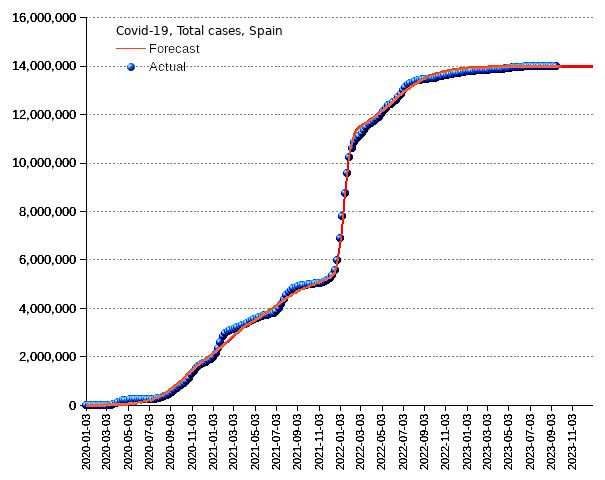

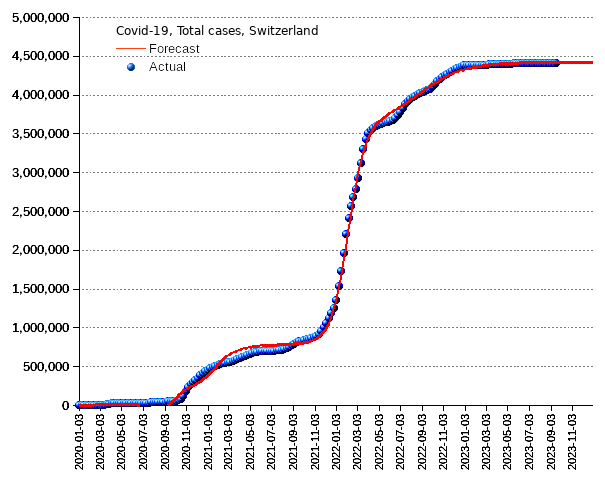

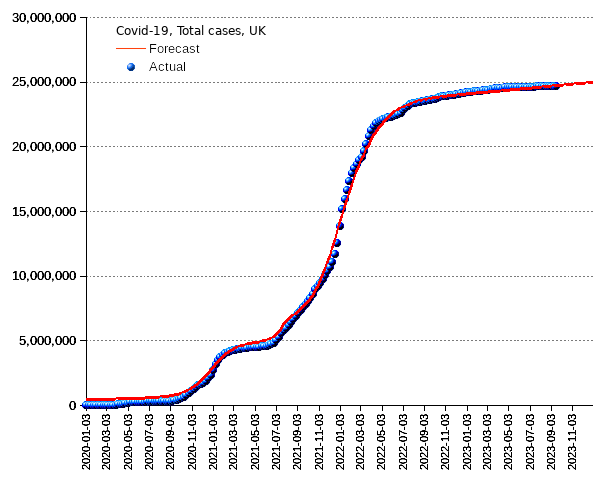

To assess the seriousness of the pandemic situation, ECDC established the following benchmarks:
| LEVEL 4 VERY HIGH | LEVEL 3 HIGH | LEVEL 2 MODERATE | LEVEL 1 LOW | |
|---|---|---|---|---|
| Incidence Rate (New reported cases over past 28 days per 100,000 population) | More than 500 | 100-500 | 50-99 | Fewer than 50 |
March 2020 : 21 22 23 24 25 26 27 28 29 30 31
April 2020 : 1 2 3 4 5 6 7 8 9 10 11 12 13 14 16 17 18 19 20 21 22 23 24 25 26 27 28 29 30
May 2020 : 1 2 3 4 5 6 7 8 9 10 11 12 13 14 15 16 17 18 19 20 21 22 23 24 25 26 27 28 29 30 31
June 2020 : 1 2 3 4 5 6 7 8 9 10 11 12 13 14 15 16 17 19 20 21 22 23 24 25 26 27 28 29 30
July 2020 : 1 2 3 4 5 6 7 8 9 9 10 11 12 13 14 15 16 17 18 19 20 21 22 23 24 25 26 27 28 29 30 31
August 2020 : 1 2 3 4 5 6 7 8 9 10 11 12 13 14 15 16 17 18 19 20 21 22 23 24 25 26 27 28 29 30 31
September 2020 : 1 2 3 4 5 6 7 8 9 10 11 12 13 14 15 16 17 18 19 20 21 22 23 24 25 26 27 28 29 30
October 2020 : 1 2 3 4 5 6 7 8 9 10 11 12 13 14 15 16 17 18 19 20 21 22 23 24 25 26 27 28 29 30 31
November 2020 : 1 2 3 4 5 6 7 8 9 10 11 12 13 14 15 16 17 18 19 20 21 22 23 24 25 26 27 28 29 30
December 2020 : 1 7 10 13 17 23 30
January 2021 : Week 1 Week 2 Week 3 Week 4
February 2021 : Week 1 Week 2 Week 3 Week 4
March 2021 : Week 1 Week 2 Week 3 Week 4 Week 5
April 2021 : Week 1 Week 2 Week 3 Week 4
May 2021 : Week 1 Week 2 Week 3 Week 4 Week 5
June 2021 : Week 1 Week 2 Week 3 Week 4
July 2021 : Week 1 Week 2 Week 3 Week 4 Week 5
August 2021 : Week 1 Week 2 Week 3 Week 4
September 2021 : Week 1 Week 2 Week 3 Week 4
October 2021 : Week 1 Week 2 Week 3 Week 4 Week 5
November 2021 : Week 1 Week 2 Week 3 Week 4
December 2021 : Week 1 Week 2 Week 3 Week 4 (ECDC data not issued)
January 2022 : Week 1 Week 2 Week 3 Week 4 Week 5
February 2022 : Week 1 Week 2 Week 3 Week 4
March 2022 : Week 1 Week 2 Week 3 Week 4
April 2022 : Week 1 Week 2 Week 3 Week 4 Week 5
May 2022 : Week 1 Week 2 Week 3 Week 4
June 2022 : Week 1 Week 2 Week 3
July 2022 : 2022-07-08 2022-07-17 2022-07-24 2022-07-31
August 2022 : 2022-08-07 2022-08-14 2022-08-21 2022-08-28
September 2022 : 2022-09-04 2022-09-11 2022-09-18 2022-10-02
October 2022 : 2022-10-18
November 2022 : 2022-11-20 2022-11-27
December 2022 : 2022-12-04 2022-12-11 2022-12-18
January 2023 : 2023-01-08 2023-01-15 2023-01-22
February 2023 : 2023-02-05 2023-02-19 2023-02-26
March 2023 : 2023-03-05 2023-03-12 2023-03-19 2023-03-26 2023-04-02
April 2023 : 2023-04-09 2023-04-16 2023-04-23 2023-04-30
May 2023 : 2023-05-07 2023-05-14 2023-05-21 2023-05-28
June 2023 : 2023-06-04 2023-06-11 2023-06-18 2023-06-25
July 2023 : 2023-07-02 2023-07-09 2023-07-16 2023-07-23 2023-07-30
August 2023 : 2023-08-06 2023-08-13 2023-08-20 2023-08-27
September 2023 : 2023-09-03 2023-09-10 2023-09-17