areppim: information, pure and simple
![]() Actual data from ECDC (EU's European Centre for Disease Prevention and Control), and areppim S-curve projections for selected countries:
Actual data from ECDC (EU's European Centre for Disease Prevention and Control), and areppim S-curve projections for selected countries:
| World total deaths | World total cases | 14-day cumulative notifications | China total cases | France total cases | Germany total cases | Iran total cases | Italy total cases | Portugal total cases | Spain total cases | Switzerland total cases | United Kingdom total cases | United States total cases |

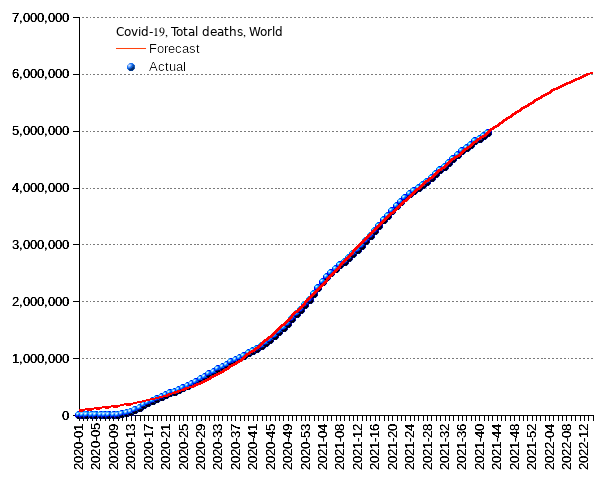
Week ending on 24 October 2021, World:
Death toll: 4,955,737 or 2.03 of the infected cases.
New deaths: 46,038.
Total infection cases: 244,112,316 or 3.10 percent of the population.
New infection cases: 2,850,231 or a new infection ratio of 36.19 per 100,000 people.
Our projection is obtained by a logistic regression based on the actual numbers provided by ECDC. In those cases where significant bumps in the time series suggest a definite change of direction, we fitted the regression curve by means of a multi-logistic function.

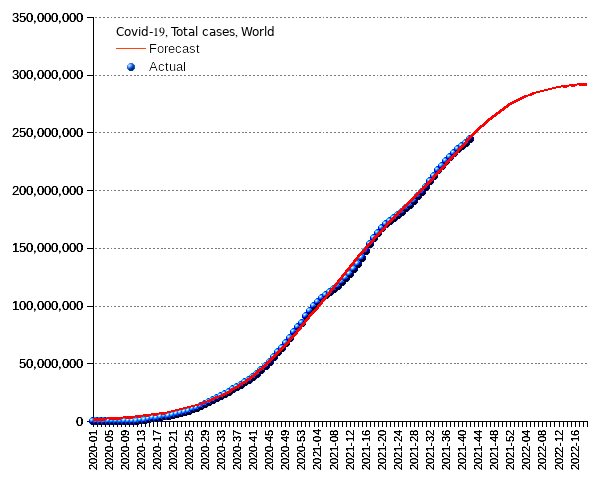
Week ending on 24 October 2021, World:
Total infection cases: 244,112,316 or 3.10 percent of the population.
New cases: 2,850,231 or a new infection ratio of 36.19 per 100,000 people.
New deaths: 46,038.
Death toll: 4,955,737 or 2.03 percent of the infected cases.
By continent:
Africa total cases : 8,468,345 or 3.47% ; total deaths : 216,840 or 4.38% .
America total cases : 93,120,479 or 38.15% ; total deaths : 2,282,980 or 46.07% .
Asia total cases : 69,305,855 or 28.39% ; total deaths : 1,072,213 or 21.64% .
Europe total cases : 72,899,300 or 29.86% ; total deaths : 1,379,898 or 27.84% .
Oceania total cases : 318,337 or 0.13% ; total deaths : 3,806 or 0.08% .
The pandemic containment, partially achieved after the administrations enforced anti-contagion measures upon the pandemic declaration by the World Health Organization in March 2020, gave way to a generalized surge of the infection with the arrival of the summer season. Thereafter, executives indulged in a choreography of stop-and-go steps, easing the prophylactic measures as soon as the contagion rates seemed to slow down, only to reinstate stricter rules as the rates started to increase again. The inevitable result has been a protracted pandemic, aggravated by the surge of virus variants, and a prolonged economic and social suffering.
People in charge defined their dilemma as a choice between saving the economy, or saving the public health, and allegedly opted for the first option, the economy.They took that course of action without implementing the specific instruments and tools to trace the disease, test the suspected cases, quarantinize and take care of the positive ones, while ensuring that people in need without a remunerated job would get a minimum income, and citizens could go about their business enjoying safe transportation, safe shopping, and safe work conditions. The responsible agencies should have reconfigured or provided such facilities, in the absence of which the pandemic couldn’t but enjoy a new boom. The net result has been both an interminable health chaos and a looming economic collapse.
Our forecasts show that the pandemic will spread further along the year, although it will fade out eventually. The question is when will this happen. Equally important, what will be the final price to pay for the incompetence of those in power. It is highly likely that the latter will have sacrificed public health on the altar of the economy, without achieving anything but another mega economic crisis, leaving behind a trail of several million fatalities, and of scores of millions of convalescents in a more or less pitiful shape. Quite a repulsing and contemptible record!

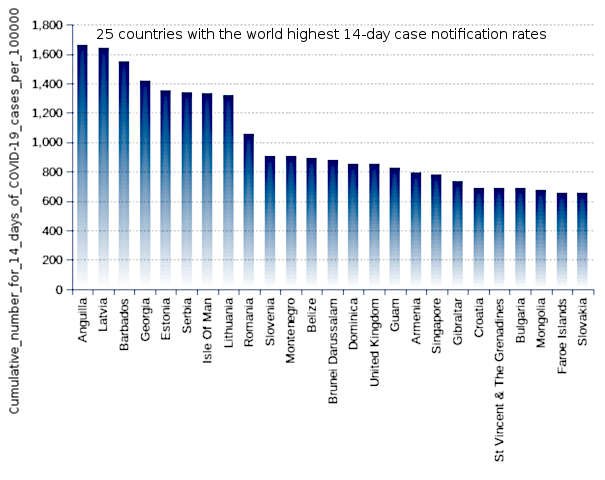
Week ending on 24 October 2021, these are the 25 countries with the world highest 14-day case notification rates. The 14-day notification rate of new Covid-19 cases is one of the main indicators used by ECDC to build its recommendations. Some significant markers:
World 14-day notification rate — median : 27 | highest : 500 .
Africa 14-day notification rate — median : 11 | highest : 42 .
America 14-day notification rate — median : 198 | highest : 500 .
Asia 14-day notification rate — median : 26 | highest : 147 .
Europe 14-day notification rate — median : 155 | highest : 466 .
Oceania 14-day notification rate — median : 6 | highest : 96 .


Week ending on 24 October 2021, China:
Total infection cases: 109,197 or 0.01 percent of the population.
New cases: 276 or a new infection ratio of 0.019 per 100,000 people.
New deaths: 0.
Death toll: 4,849 or 4.44 percent of the infected cases.

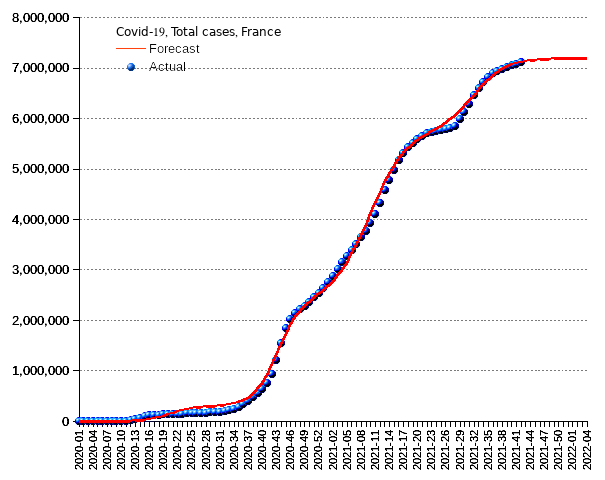
Week ending on 24 October 2021, France:
Total infection cases: 7,115,118 or 10.57 percent of the population.
New cases: 35,640 or a new infection ratio of 52.94 per 100,000 people-->.
New deaths: 200.
Death toll: 121,443 or 1.71 percent of the infected cases.

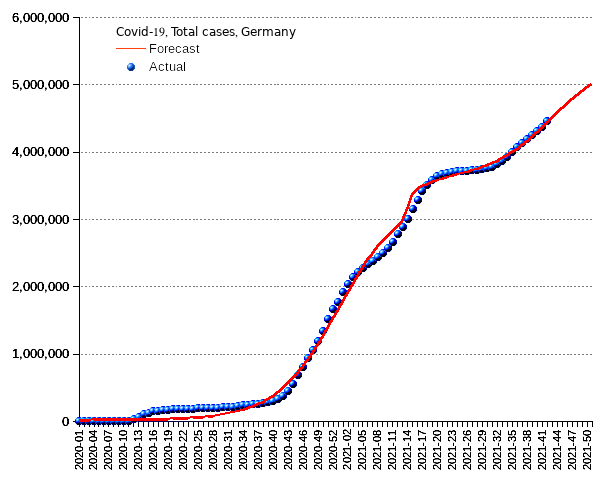
Week ending on 24 October 2021, Germany:
Total infection cases: 4,463,052 or 5.37 percent of the population.
New cases: 91,522 or a new infection ratio of 110.05 per 100,000 people-->.
New deaths: 232.
Death toll: 94,627 or 2.12 percent of the infected cases.

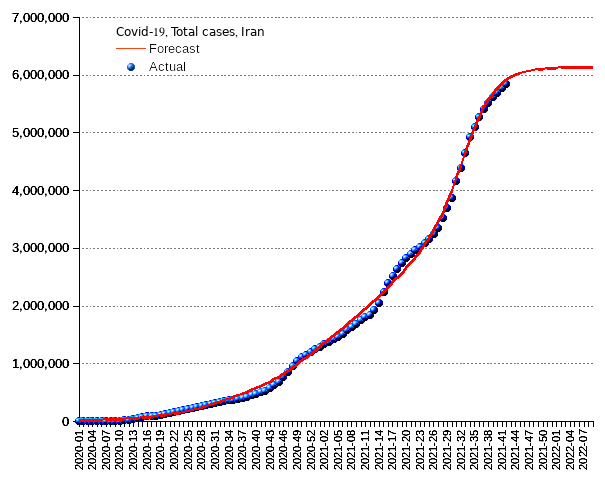
Week ending on 24 October 2021, Iran:
Total infection cases: 5,851,670 or 6.97 percent of the population.
New cases: 78,251 or a new infection ratio of 93.16 per 100,000 people.
New deaths: 1,176.
Death toll: 125,052 or 2.14 percent of the infected cases.

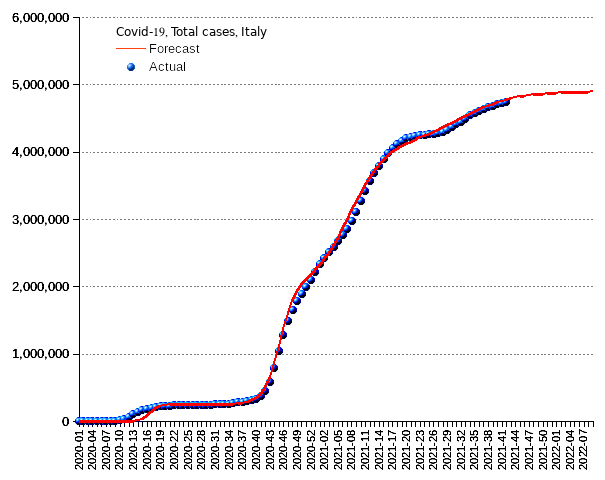
Week ending on 24 October 2021, Italy:
Total infection cases: 4,742,131 or 7.95 percent of the population.
New cases: 17,614 or a new infection ratio of 29.53 per 100,000 people.
New deaths: 162.
Death toll: 132,287 or 2.79 percent of the infected cases.

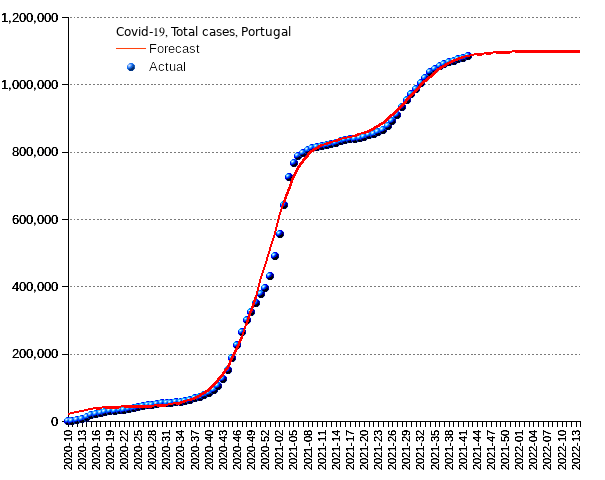
Week ending on 24 October 2021, Portugal:
Total infection cases: 1,085,448 or 10.54 percent of the population.
New cases: 5,242 or a new infection ratio of 50.91 per 100,000 people.
New deaths: 38.
Death toll: 18,135 or 1.67 percent of the infected cases.

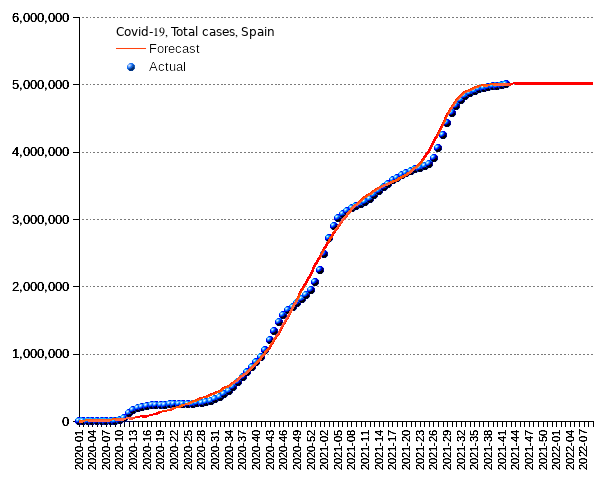
Week ending on 24 October 2021, Spain:
Total infection cases: 5,003,034 or 10.57 percent of the population.
New cases: 7,466 or a new infection ratio of 15.77 per 100,000 people.
New deaths: 3.
Death toll: 87,168 or 1.74 percent of the infected cases.

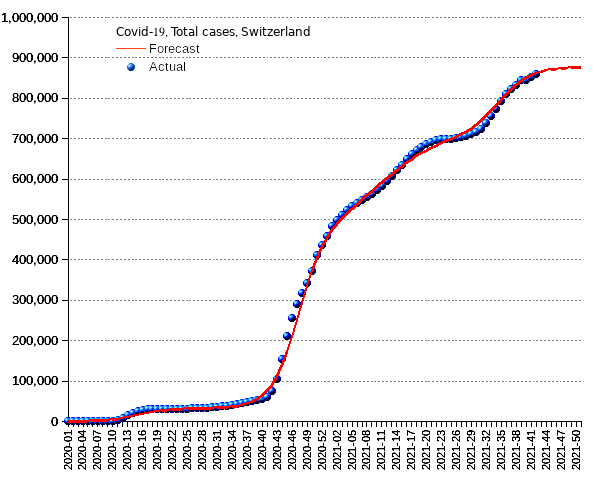
Week ending on 24 October 2021, Switzerland:
Total infection cases: 858,779 or 9.98 of the population.
New cases: 5,430 or a new infection ratio of 63.10 per 100,000 people.
New deaths: 17.
Death toll: 10,754 or 1.25 of the infected cases.

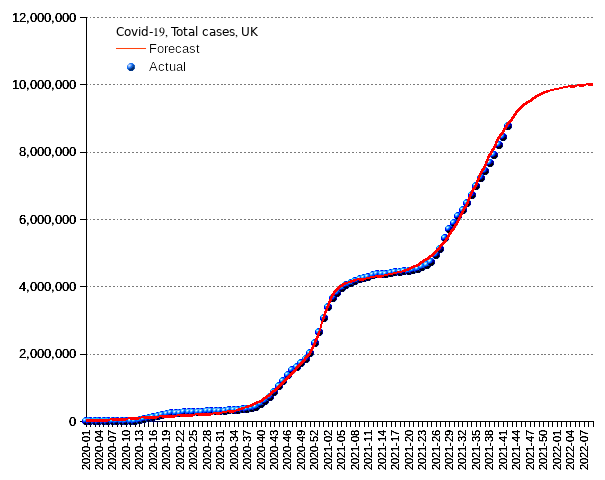
Week ending on 24 October 2021, United Kingdom:
Total infection cases: 8,773,674 or 12.89 percent of the population.
New cases: 324,509 or a new infection ratio of 476.80 per 100,000 people.
New deaths: 949.
Death toll: 139,533 or 1.59 percent of the infected cases.

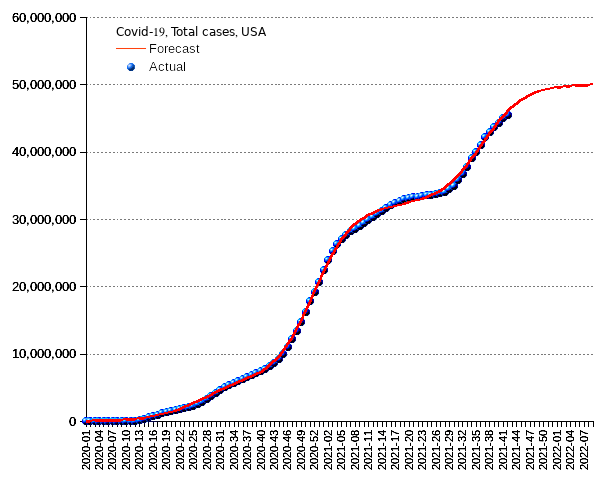
Week ending on 24 October 2021, USA:
Total infection cases: 45,444,816 or 13.73 percent of the population.
New cases: 435,826 or a new infection ratio of 131.67 per 100,000 people.
New deaths: 10,611.
Death toll: 735,941 or 1.62 percent of the infected cases.
To assess the seriousness of the pandemic situation, ECDC established the following benchmarks:
| LEVEL 4 VERY HIGH | LEVEL 3 HIGH | LEVEL 2 MODERATE | LEVEL 1 LOW | |
|---|---|---|---|---|
| Incidence Rate (new cases over past 28 days per 100,000 population) | More than 500 | 100-500 | 50-99 | Fewer than 50 |
March 2020 : 21 22 23 24 25 26 27 28 29 30 31
April 2020 : 1 2 3 4 5 6 7 8 9 10 11 12 13 14 16 17 18 19 20 21 22 23 24 25 26 27 28 29 30
May 2020 : 1 2 3 4 5 6 7 8 9 10 11 12 13 14 15 16 17 18 19 20 21 22 23 24 25 26 27 28 29 30 31
June 2020 : 1 2 3 4 5 6 7 8 9 10 11 12 13 14 15 16 17 19 20 21 22 23 24 25 26 27 28 29 30
July 2020 : 1 2 3 4 5 6 7 8 9 9 10 11 12 13 14 15 16 17 18 19 20 21 22 23 24 25 26 27 28 29 30 31
August 2020 : 1 2 3 4 5 6 7 8 9 10 11 12 13 14 15 16 17 18 19 20 21 22 23 24 25 26 27 28 29 30 31
September 2020 : 1 2 3 4 5 6 7 8 9 10 11 12 13 14 15 16 17 18 19 20 21 22 23 24 25 26 27 28 29 30
October 2020 : 1 2 3 4 5 6 7 8 9 10 11 12 13 14 15 16 17 18 19 20 21 22 23 24 25 26 27 28 29 30 31
November 2020 : 1 2 3 4 5 6 7 8 9 10 11 12 13 14 15 16 17 18 19 20 21 22 23 24 25 26 27 28 29 30
December 2020 : 1 7 10 13 17 23 30
January 2021 : Week 1 Week 2 Week 3 Week 4
February 2021 : Week 1 Week 2 Week 3 Week 4
March 2021 : Week 1 Week 2 Week 3 Week 4 Week 5
April 2021 : Week 1 Week 2 Week 3 Week 4
May 2021 : Week 1 Week 2 Week 3 Week 4 Week 5
June 2021 : Week 1 Week 2 Week 3 Week 4
July 2021 : Week 1 Week 2 Week 3 Week 4 Week 5
August 2021 : Week 1 Week 2 Week 3 Week 4