areppim: information, pure and simple
![]() Actual data from WHO (World Health Organization), and areppim S-curve projections for selected countries:
Actual data from WHO (World Health Organization), and areppim S-curve projections for selected countries:
| World total deaths | World total cases | 14-day cumulative notifications | China total cases | France total cases | Germany total cases | Iran total cases | Italy total cases | Portugal total cases | Spain total cases | Switzerland total cases | United Kingdom total cases | United States total cases |

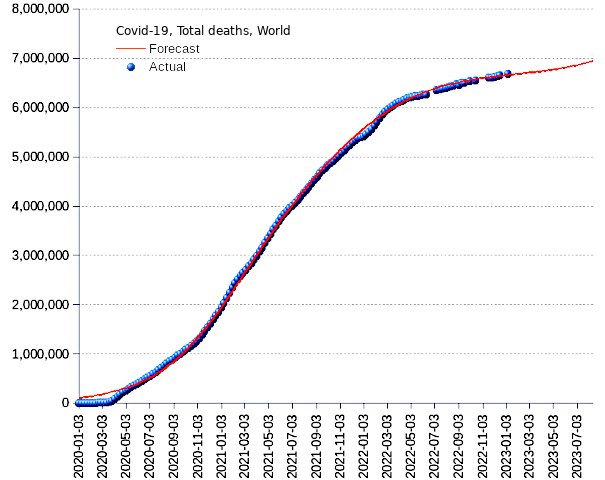
Situation as of 9 January 2023, World:
Death toll: 6,684,756 or 1.01 percent of the infected cases.
New reported deaths: 7,148.
Total infection cases: 659,108,952 or 8.29 percent of the population.
New infection cases: 2,354,066 or a new infection ratio of 29.60 per 100,000 people.
How many fatalities did Covid-19 actually cause? Official WHO data says close to 7 million at the present date. But a recently published WHO study estimates 14.83 million excess deaths globally, 2.74 times more deaths than the 5.42 million reported as due to COVID-19 for the period
2020-2021.
Our projection is obtained by a logistic regression based on the actual numbers provided by ECDC and by WHO. In those cases where significant bumps in the time series suggest a definite change of direction, we fitted the regression curve by means of a multi-logistic function.

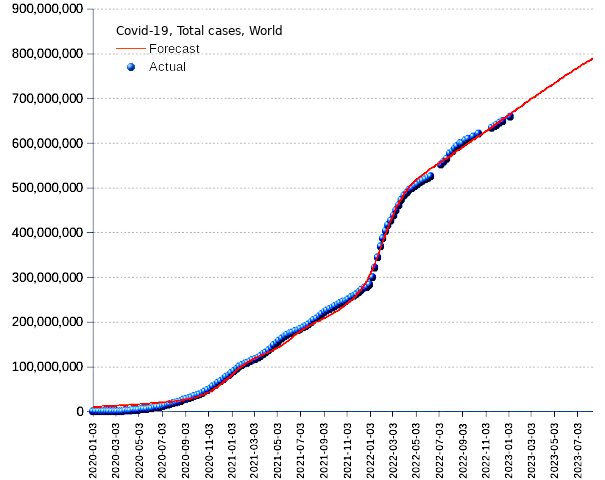
Situation as of 9 January 2023, World:
Total infection cases: 659,108,952 or 8.29 percent of the population.
New reported cases: 2,354,066 or a new infection ratio of 29.60 per 100,000 people.
New reported deaths: 7,148.
Death toll: 6,684,756 or 1.01 percent of the infected cases.
| Total cases | Total deaths | Total vaccine doses per 100 population | |||
|---|---|---|---|---|---|
| Region | Nbr | Percent | Nbr | Percent | Nbr |
| Africa | 9,456,372 | 1.4% | 175,152 | 2.6% | 48.78 |
| Americas | 186,408,289 | 28.3% | 2,891,913 | 43.3% | 203.21 |
| Eastern Mediterranean | 23,227,543 | 3.5% | 349,141 | 5.2% | 115.62 |
| Europe | 270,518,301 | 41.0% | 2,164,634 | 32.4% | 181.74 |
| South-East Asia | 60,744,418 | 9.2% | 803,381 | 12.0% | 162.89 |
| Western Pacific | 108,753,265 | 16.5% | 300,522 | 4.5% | 234.9 |
| Global | 659,108,952 | 100.0% | 6,684,756 | 100.0% | 167.73 |
| Source : WHO Coronavirus (COVID-19) Dashboard retrieved on 9 January 2023. | |||||
The pandemic drive is losing steam after two years of havoc, since the World Health Organization (WHO) issued its official coming-into-being statement in March 2020. Although the WHO sourced data suggests a slowdown, our forecasts regretfully say that may not be exactly the case. The number of cases and of Covid-related fatalities may still grow significantly in the course of the next months. The game is not over yet.
Historians will endeavor to sort out in due course the real low-down of this episode with its gloomy implications – in excess of 600 million sick people and close to 7 million fatalities, not to mention the dire social and economic consequences. We will also have to learn from its grotesque contours. The disorder created by the health authorities during the first year of the disease; the ridiculous pose of political leaders, including Trump, Boris Johnson, Bolsonaro, Macron; or the total inability of the authorities to harmonize their action at the international level, notwithstanding the much-vaunted capabilities of the international coordination organizations.

Source: WHO, retrieved on 9 January 2023.

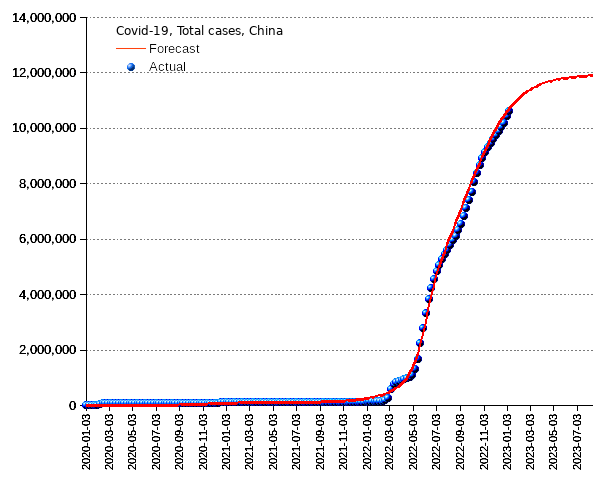
Situation as of 8 January 2023, China:
Total infection cases: 10,623,684 or 0.73 percent of the population.
New reported cases: 26,735 or a new infection ratio of 1.85 percent per 100,000 people.
New reported deaths: 133.
Death toll: 33,042 or 0.31 percent of the infected cases.

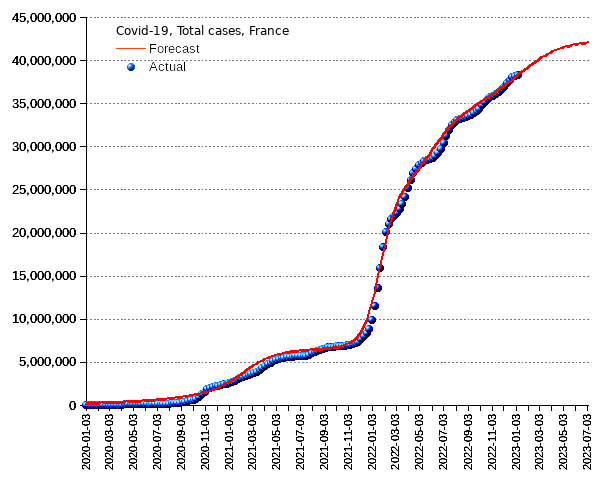
Situation as of 8 January 2023, France:
Total infection cases: 38,298,831 or 58.40 percent of the population.
New reported cases: 0 or a new infection ratio of 0 per 100,000 people.
New reported deaths: 0.
Death toll: 159,001 or 0.42 percent of the infected cases.

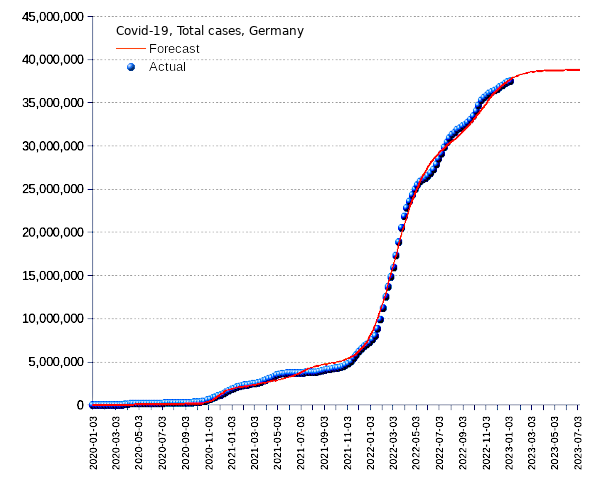
Situation as of 8 January 2023, Germany:
Total infection cases: 37,509,539 or 44.72 percent of the population.
New reported cases: 0 or a new infection ratio of 0 per 100,000 people.
New reported deaths: 0.
Death toll: 162,688 or 0.43 of the infected cases.

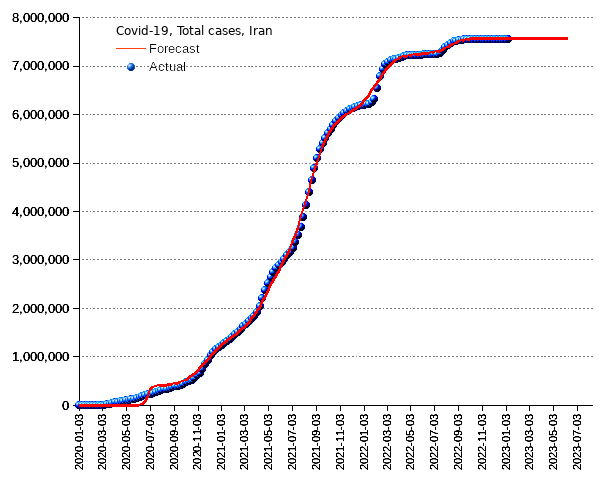
Situation as of 8 January 2023, Iran:
Total infection cases: 7,561,808 or 8.79 percent of the population.
New reported cases: 107 or a new infection ratio of 0.12 per 100,000 people.
New reported deaths: 2.
Death toll: 144,706 or 1.91 percent of the infected cases.

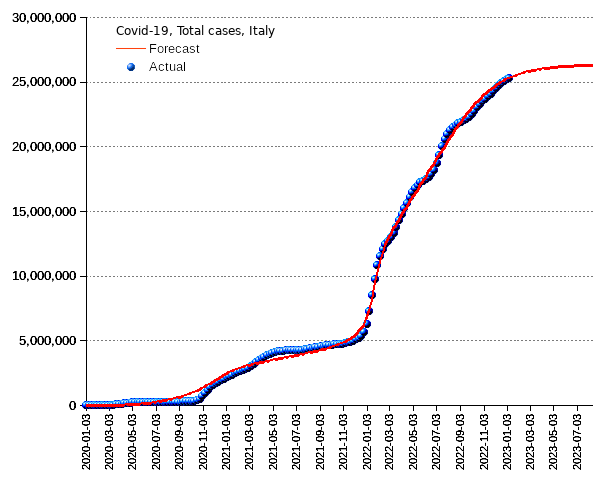
Situation as of 8 January 2023, Italy:
Total infection cases: 25,279,682 or 41.95 percent of the population.
New reported cases: 0 or a new infection ratio of 0 per 100,000 people.
New reported deaths: 0.
Death toll: 185,417 or 0.73 percent of the infected cases.

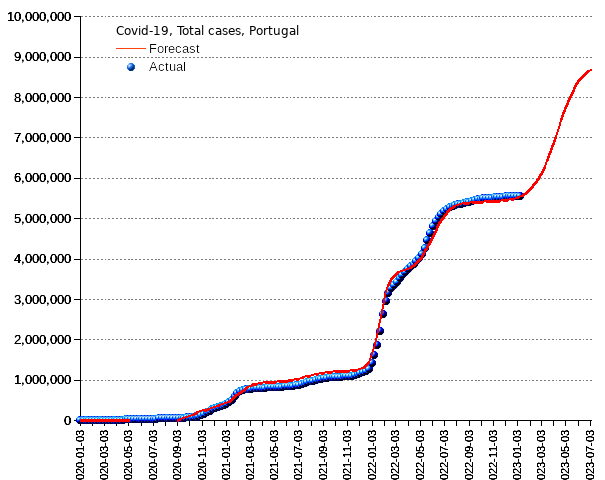
Situation as of 8 January 2023, Portugal:
Total infection cases: 5,557,941 or 54.81 percent of the population.
New reported cases: 0 or a new infection ratio of 0 per 100,000 people.
New reported deaths: 0.
Death toll: 25,805 or 0.46 percent of the infected cases.

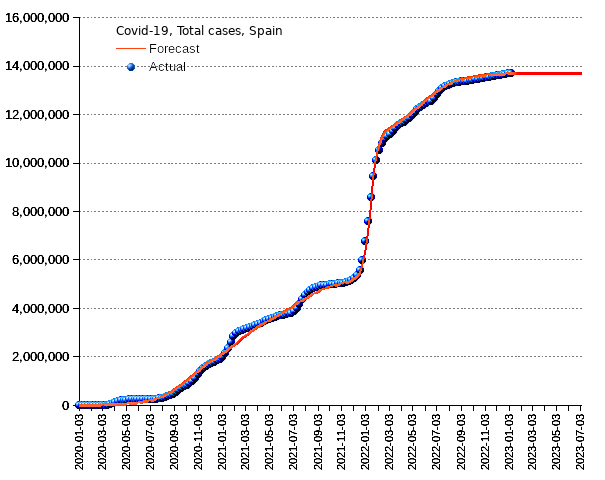
Situation as of 8 January 2023, Spain:
Total infection cases: 13,693,478 or 29.31 percent of the population.
New reported cases: 0 or a new infection ratio of 0 per 100,000 people.
New reported deaths: 0.
Death toll: 117,413 or 0.86 percent of the infected cases.

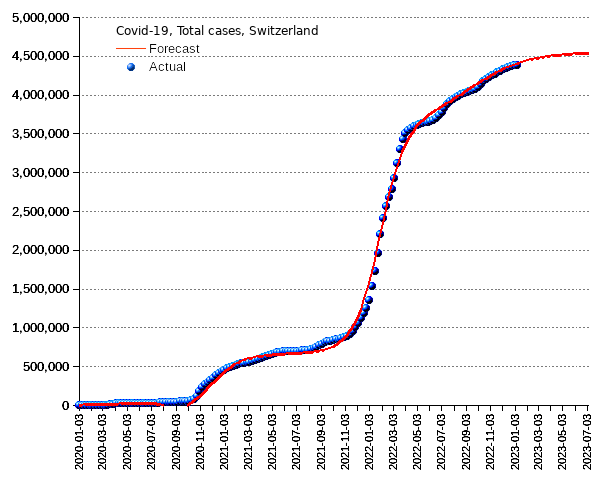
Situation as of 8 January 2023, Switzerland:
Total infection cases: 4,382,364 or 49.95 of the population.
New reported cases: 0 or a new infection ratio of 0 per 100,000 people.
New reported deaths: 0.
Death toll: 13,874 or 0.32 of the infected cases.

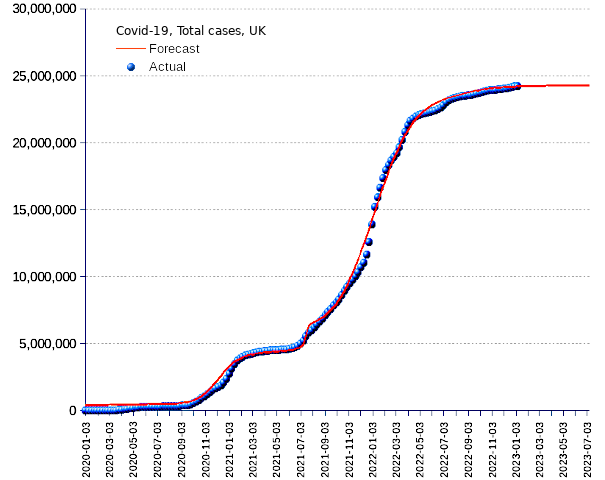
Situation as of 8 January 2023, United Kingdom:
Total infection cases: 24,210,131 or 35.34 percent of the population.
New reported cases: 0 or a new infection ratio of 0 per 100,000 people.
New reported deaths: 0.
Death toll: 201,028 or 0.83 percent of the infected cases.

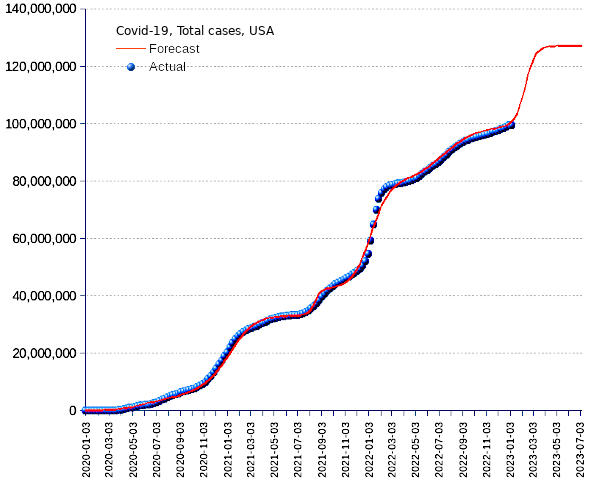
Situation as of 8 January 2023, USA:
Total infection cases: 99,423,758 or 29.70 percent of the population.
New reported cases: 0 or a new infection ratio of 0 per 100,000 people.
New reported deaths: 0.
Death toll: 1,082,265 or 1.09 percent of the infected cases.
To assess the seriousness of the pandemic situation, ECDC established the following benchmarks:
| LEVEL 4 VERY HIGH | LEVEL 3 HIGH | LEVEL 2 MODERATE | LEVEL 1 LOW | |
|---|---|---|---|---|
| Incidence Rate (New reported cases over past 28 days per 100,000 population) | More than 500 | 100-500 | 50-99 | Fewer than 50 |
March 2020 : 21 22 23 24 25 26 27 28 29 30 31
April 2020 : 1 2 3 4 5 6 7 8 9 10 11 12 13 14 16 17 18 19 20 21 22 23 24 25 26 27 28 29 30
May 2020 : 1 2 3 4 5 6 7 8 9 10 11 12 13 14 15 16 17 18 19 20 21 22 23 24 25 26 27 28 29 30 31
June 2020 : 1 2 3 4 5 6 7 8 9 10 11 12 13 14 15 16 17 19 20 21 22 23 24 25 26 27 28 29 30
July 2020 : 1 2 3 4 5 6 7 8 9 9 10 11 12 13 14 15 16 17 18 19 20 21 22 23 24 25 26 27 28 29 30 31
August 2020 : 1 2 3 4 5 6 7 8 9 10 11 12 13 14 15 16 17 18 19 20 21 22 23 24 25 26 27 28 29 30 31
September 2020 : 1 2 3 4 5 6 7 8 9 10 11 12 13 14 15 16 17 18 19 20 21 22 23 24 25 26 27 28 29 30
October 2020 : 1 2 3 4 5 6 7 8 9 10 11 12 13 14 15 16 17 18 19 20 21 22 23 24 25 26 27 28 29 30 31
November 2020 : 1 2 3 4 5 6 7 8 9 10 11 12 13 14 15 16 17 18 19 20 21 22 23 24 25 26 27 28 29 30
December 2020 : 1 7 10 13 17 23 30
January 2021 : Week 1 Week 2 Week 3 Week 4
February 2021 : Week 1 Week 2 Week 3 Week 4
March 2021 : Week 1 Week 2 Week 3 Week 4 Week 5
April 2021 : Week 1 Week 2 Week 3 Week 4
May 2021 : Week 1 Week 2 Week 3 Week 4 Week 5
June 2021 : Week 1 Week 2 Week 3 Week 4
July 2021 : Week 1 Week 2 Week 3 Week 4 Week 5
August 2021 : Week 1 Week 2 Week 3 Week 4
September 2021 : Week 1 Week 2 Week 3 Week 4
October 2021 : Week 1 Week 2 Week 3 Week 4 Week 5
November 2021 : Week 1 Week 2 Week 3 Week 4
December 2021 : Week 1 Week 2 Week 3 Week 4 (ECDC data not issued)
January 2022 : Week 1 Week 2 Week 3 Week 4 Week 5
February 2022 : Week 1 Week 2 Week 3 Week 4
March 2022 : Week 1 Week 2 Week 3 Week 4
April 2022 : Week 1 Week 2 Week 3 Week 4 Week 5
May 2022 : Week 1 Week 2 Week 3 Week 4
June 2022 : Week 1 Week 2 Week 3
July 2022 : 2022-07-08 2022-07-17 2022-07-24 2022-07-31
August 2022 : 2022-08-07 2022-08-14 2022-08-21 2022-08-28
September 2022 : 2022-09-04 2022-09-11 2022-09-18 2022-10-02
October 2022 : 2022-10-18
November 2022 : 2022-11-20 2022-11-27
December 2022 : 2022-12-04 2022-12-11 2022-12-18
January 2023 : 2023-01-08