areppim: information, pure and simple
![]() Actual data from ECDC (EU's European Centre for Disease Prevention and Control), and areppim S-curve projections for selected countries:
Actual data from ECDC (EU's European Centre for Disease Prevention and Control), and areppim S-curve projections for selected countries:
| World total deaths | World total cases | 14-day cumulative notifications | China total cases | France total cases | Germany total cases | Iran total cases | Italy total cases | Portugal total cases | Spain total cases | Switzerland total cases | United Kingdom total cases | United States total cases |

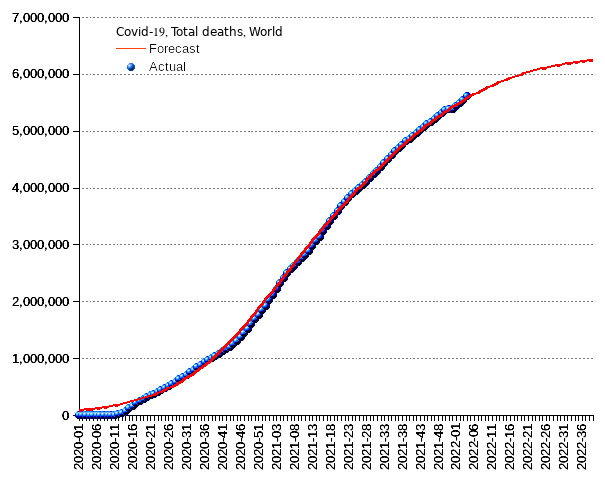
Week ending on 30 January 2022, World:
Death toll: 5,617,231 or 1.54 of the infected cases.
New deaths: 74,574.
Total infection cases: 365,787,703 or 4.64 percent of the population.
New infection cases: 23,888,259 or a new infection ratio of 303.34 per 100,000 people.
Our projection is obtained by a logistic regression based on the actual numbers provided by ECDC. In those cases where significant bumps in the time series suggest a definite change of direction, we fitted the regression curve by means of a multi-logistic function.

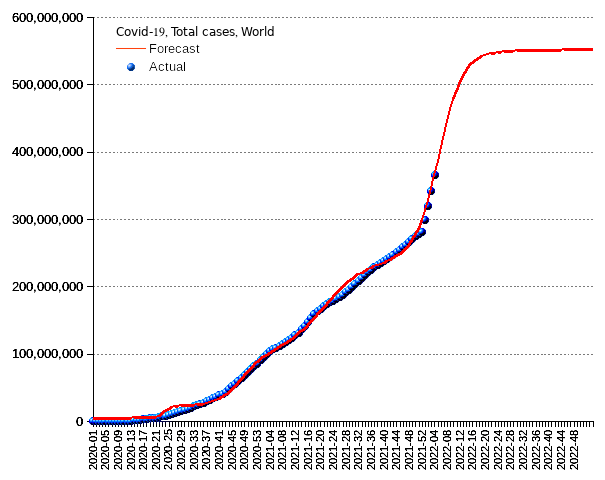
Week ending on 30 January 2022, World:
Total infection cases: 365,787,703 or 4.64 percent of the population.
New cases: 23,888,259 or a new infection ratio of 303.34 per 100,000 people.
New deaths: 74,574.
Death toll: 5,617,231 or 1.54 percent of the infected cases.
By continent:
Africa total cases : 10,259,021 or 2.83% ; total deaths : 235,552 or 4.20% .
America total cases : 131,428,072 or 36.24% ; total deaths : 2,490,036 or 44.41% .
Asia total cases : 85,149,999 or 23.48% ; total deaths : 1,169,653 or 20.86% .
Europe total cases : 133,645,199 or 36.86% ; total deaths : 1,705,091 or 30.41% .
Oceania total cases : 2,129,785 or 0.59% ; total deaths : 6,274 or 0.11% .
The pandemic containment, partially achieved after the administrations enforced anti-contagion measures upon the pandemic declaration by the World Health Organization in March 2020, gave way to a generalized surge of the infection with the arrival of the summer season. Thereafter, executives indulged in a choreography of stop-and-go steps, easing the prophylactic measures as soon as the contagion rates seemed to slow down, only to reinstate stricter rules as the rates started to increase again. The inevitable result has been a protracted pandemic, aggravated by the surge of virus variants, and a prolonged economic and social suffering.
Powers that be defined their dilemma as a choice between saving the economy, or saving the public health, and allegedly opted for the first option, the economy. In fact, it seems that they have chosen not to choose, letting themselves be led by the one who shouts louder, their real concern being not to alienate their electoral patrons. Whatever the case, they failed to implement the specific instruments and tools to trace the disease, test the suspected cases, quarantinize and take care of the positive ones, while ensuring that people in need without a remunerated job would get a minimum income, and citizens could go about their business enjoying safe transportation, safe shopping, and safe work conditions. The responsible agencies should have reconfigured or provided such facilities, in the absence of which the pandemic couldn’t but enjoy a new boom. The net result has been both an interminable health chaos, a looming economic collapse, and the widespread alienation of the democratic vote.
Our forecasts show that the pandemic will spread further along the months, although it will fade out eventually. The question is when will this happen. Equally important, what will be the final price to pay for the incompetence of those in power. It is highly likely that the latter will have sacrificed public health on the altar of the economy, without achieving anything but another mega economic crisis, leaving behind a trail of several million fatalities, and of scores of millions of convalescents in a more or less pitiful shape. Quite a repulsing and contemptible record!

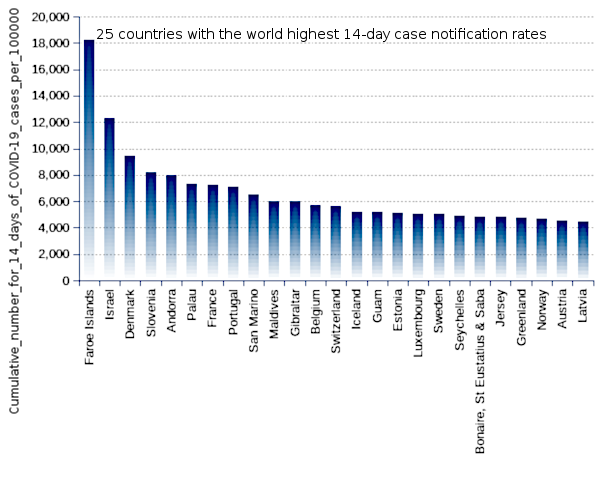
Week ending on 30 January 2022, these are the 25 countries with the world highest 14-day case notification rates. The 14-day notification rate of new Covid-19 cases is one of the main indicators used by ECDC to build its recommendations. Some significant markers:
World 14-day notification rate — median : 29 | highest : 2,496 .
Africa 14-day notification rate — median : 11 | highest : 44 .
America 14-day notification rate — median : 198 | highest : 1,606 .
Asia 14-day notification rate — median : 24 | highest : 179 .
Europe 14-day notification rate — median : 234 | highest : 2,496 .
Oceania 14-day notification rate — median : 7 | highest : 2,096 .

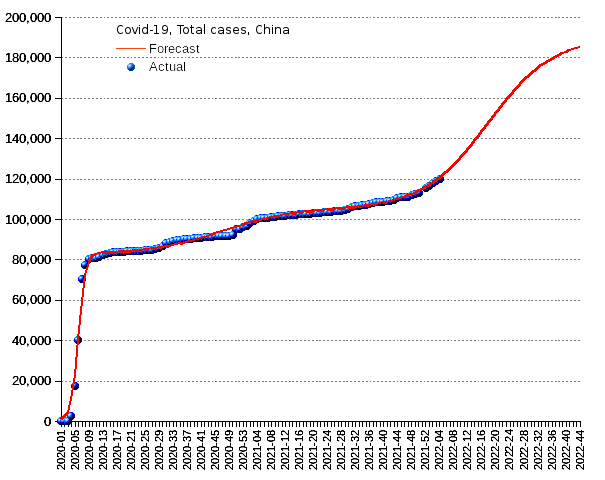
Week ending on 30 January 2022, China:
Total infection cases: 119,831 or 0.01 percent of the population.
New cases: 1,057 or a new infection ratio of 0.07 per 100,000 people.
New deaths: 0.
Death toll: 4,849 or 4.05 percent of the infected cases.

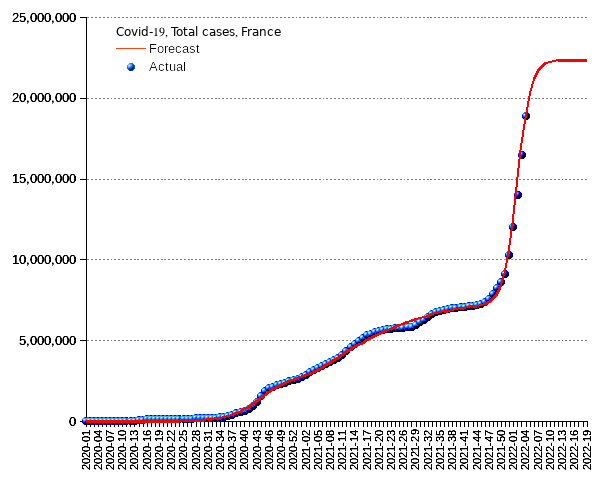
Week ending on 30 January 2022, France:
Total infection cases: 18,883,693 or 28.05 percent of the population.
New cases: 2,384,907 or a new infection ratio of 3,542.63 per 100,000 people.
New deaths: 1,989.
Death toll: 134,823 or 0.71 percent of the infected cases.

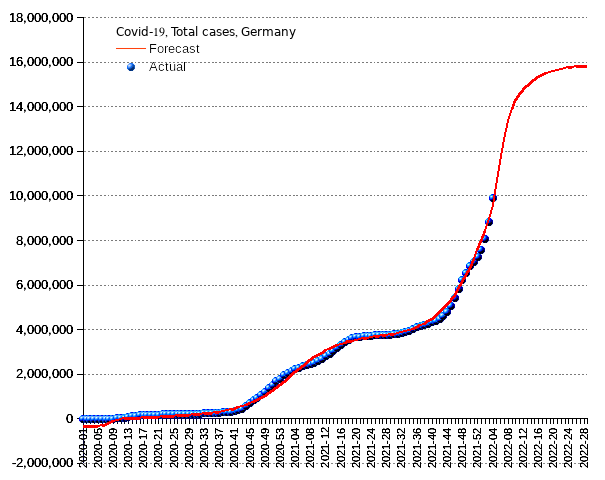
Week ending on 30 January 2022, Germany:
Total infection cases: 9,874,611 or 11.87 percent of the population.
New cases: 1,036,936 or a new infection ratio of 1,246.82 per 100,000 people-->.
New deaths: 426.
Death toll: 117,964 or 1.19 percent of the infected cases.

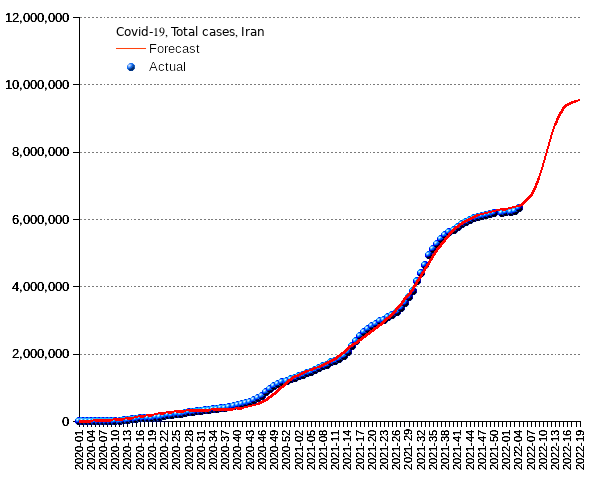
Week ending on 30 January 2022, Iran:
Total infection cases: 6,344,179 or 7.55 percent of the population.
New cases: 93,689 or a new infection ratio of 111.54 per 100,000 people.
New deaths: 194.
Death toll: 132,424 or 2.09 percent of the infected cases.

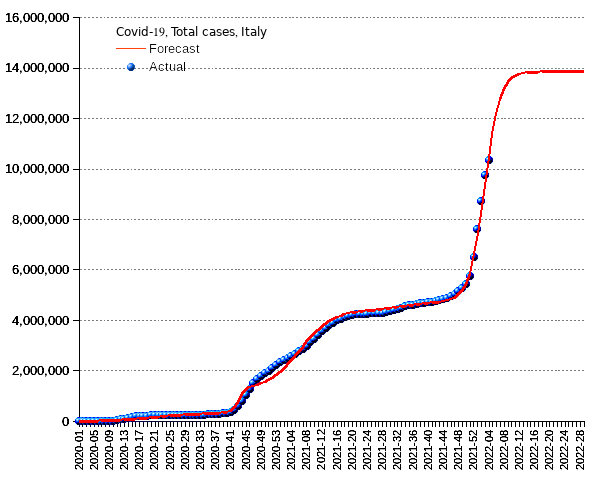
Week ending on 30 January 2022, Italy:
Total infection cases: 10,346,237 or 17.35 percent of the population.
New cases: 591,149 or a new infection ratio of 991.17 per 100,000 people.
New deaths: 2,626.
Death toll: 146,149 or 1.41 percent of the infected cases.

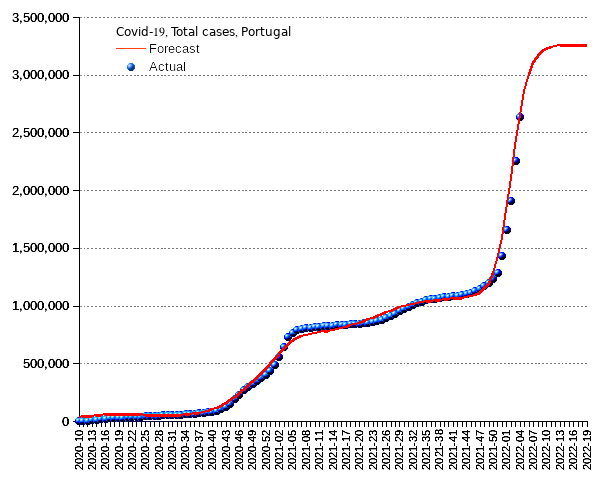
Week ending on 30 January 2022, Portugal:
Total infection cases: 2,639,710 or 25.64 percent of the population.
New cases: 385,150 or a new infection ratio of 3,740.81 per 100,000 people.
New deaths: 287.
Death toll: 19,907 or 0.75 percent of the infected cases.

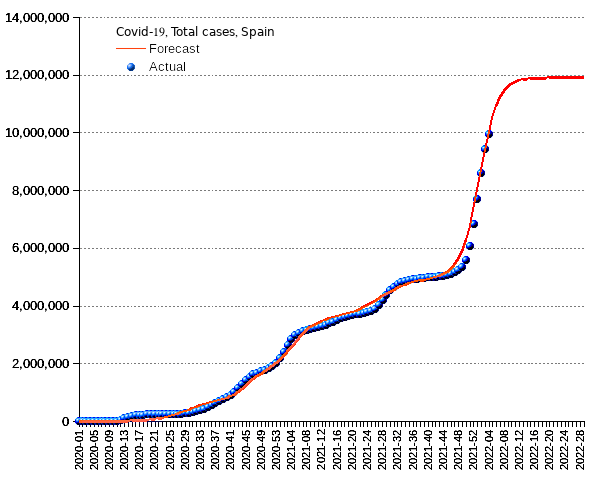
Week ending on 30 January 2022, Spain:
Total infection cases: 9,956,070 or 21.03 percent of the population.
New cases: 537,426 or a new infection ratio of 1,135.42 per 100,000 people.
New deaths: 593.
Death toll: 93,126 or 0.94 percent of the infected cases.

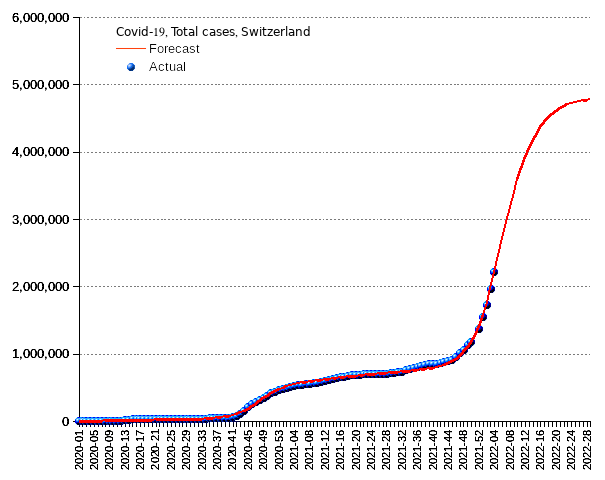
Week ending on 30 January 2022, Switzerland:
Total infection cases: 2,211,456 or 25.70 of the population.
New cases: 252,981 or a new infection ratio of 2,939.58 per 100,000 people.
New deaths: 85.
Death toll: 12,285 or 0.56 of the infected cases.


Week ending on 30 January 2022, United Kingdom:
Total infection cases: 17,375,077 or 25.53 percent of the population.
New cases: 656,657 or a new infection ratio of 964.82 per 100,000 people.
New deaths: 1,214.
Death toll: 156,844 or 0.90 percent of the infected cases.

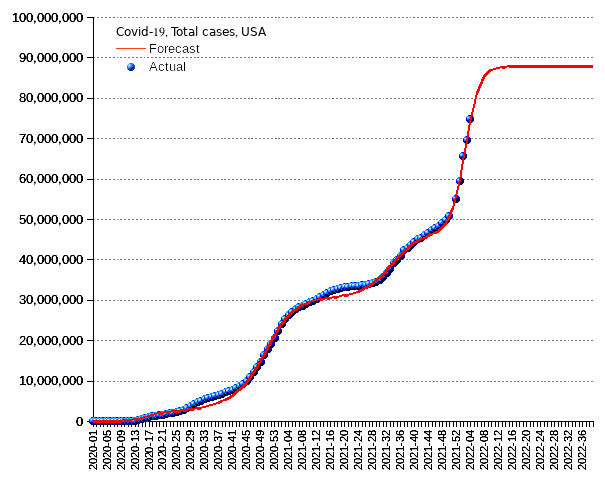
Week ending on 30 January 2022, USA:
Total infection cases: 74,938,767 or 22.64 percent of the population.
New cases: 5,207,803 or a new infection ratio of 1,573.34 per 100,000 people.
New deaths: 27,773.
Death toll: 886,668 or 1.18 percent of the infected cases.
To assess the seriousness of the pandemic situation, ECDC established the following benchmarks:
| LEVEL 4 VERY HIGH | LEVEL 3 HIGH | LEVEL 2 MODERATE | LEVEL 1 LOW | |
|---|---|---|---|---|
| Incidence Rate (new cases over past 28 days per 100,000 population) | More than 500 | 100-500 | 50-99 | Fewer than 50 |
March 2020 : 21 22 23 24 25 26 27 28 29 30 31
April 2020 : 1 2 3 4 5 6 7 8 9 10 11 12 13 14 16 17 18 19 20 21 22 23 24 25 26 27 28 29 30
May 2020 : 1 2 3 4 5 6 7 8 9 10 11 12 13 14 15 16 17 18 19 20 21 22 23 24 25 26 27 28 29 30 31
June 2020 : 1 2 3 4 5 6 7 8 9 10 11 12 13 14 15 16 17 19 20 21 22 23 24 25 26 27 28 29 30
July 2020 : 1 2 3 4 5 6 7 8 9 9 10 11 12 13 14 15 16 17 18 19 20 21 22 23 24 25 26 27 28 29 30 31
August 2020 : 1 2 3 4 5 6 7 8 9 10 11 12 13 14 15 16 17 18 19 20 21 22 23 24 25 26 27 28 29 30 31
September 2020 : 1 2 3 4 5 6 7 8 9 10 11 12 13 14 15 16 17 18 19 20 21 22 23 24 25 26 27 28 29 30
October 2020 : 1 2 3 4 5 6 7 8 9 10 11 12 13 14 15 16 17 18 19 20 21 22 23 24 25 26 27 28 29 30 31
November 2020 : 1 2 3 4 5 6 7 8 9 10 11 12 13 14 15 16 17 18 19 20 21 22 23 24 25 26 27 28 29 30
December 2020 : 1 7 10 13 17 23 30
January 2021 : Week 1 Week 2 Week 3 Week 4
February 2021 : Week 1 Week 2 Week 3 Week 4
March 2021 : Week 1 Week 2 Week 3 Week 4 Week 5
April 2021 : Week 1 Week 2 Week 3 Week 4
May 2021 : Week 1 Week 2 Week 3 Week 4 Week 5
June 2021 : Week 1 Week 2 Week 3 Week 4
July 2021 : Week 1 Week 2 Week 3 Week 4 Week 5
August 2021 : Week 1 Week 2 Week 3 Week 4
September 2021 : Week 1 Week 2 Week 3 Week 4
October 2021 : Week 1 Week 2 Week 3 Week 4 Week 5
November 2021 : Week 1 Week 2 Week 3 Week 4
December 2021 : Week 1 Week 2 Week 3 Week 4 (ECDC data not issued)