areppim: information, pure and simple

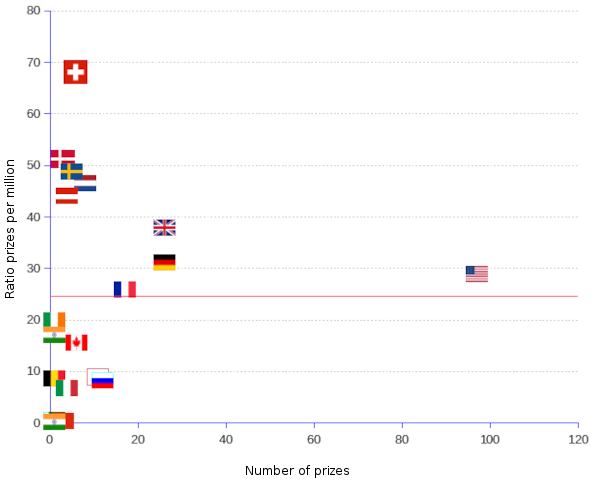
The vast scientific heritage of the prosperous European nations is vindicated by their performance in the standings for the Nobel prize for physics. Switzerland, Denmark, Sweden, Netherlands and Austria get the highest per capita indexes. Comparatively, the absolute champion United States is only the eighth. The presence of China, India and Pakistan in the list of laureates is a testimony of the effort made by the emerging powers to harness advanced knowledge and technology, namely the nuclear, information and rocket technologies.
![]() Take a look at the complete list of Nobel prizes for physics
Take a look at the complete list of Nobel prizes for physics
| Country ¹ | Number | Population 2024 | Per capita |
|---|---|---|---|
| (millions) | (number÷million×100) | ||
| Austria | 4 | 9.1 | 43.9 |
| Belgium | 1 | 11.8 | 8.5 |
| Canada | 6 | 39.3 | 15.3 |
| China | 3 | 1,457.9 | 0.2 |
| Denmark | 3 | 5.9 | 50.8 |
| France | 17 | 66.1 | 25.7 |
| Germany | 26 | 83.5 | 31.1 |
| Hungary | 1 | 9.514 | 10.5 |
| India | 1 | 1,445.0 | 0.1 |
| Ireland | 1 | 5.1 | 19.6 |
| Italy | 4 | 59.9 | 6.7 |
| Japan | 11 | 124.0 | 8.9 |
| Netherlands | 8 | 17.3 | 46.2 |
| Pakistan | 1 | 242.2 | 0.4 |
| Russia | 12 | 145.1 | 8.3 |
| Sweden | 5 | 10.4 | 48.1 |
| Switzerland | 6 | 8.9 | 67.1 |
| United Kingdom | 27 | 69.3 | 39.0 |
| United States | 98 | 340.4 | 28.8 |
| Total | 235 | ||
| Median | 19.6 | ||
| Average | 24.2 | ||
| ¹ Double nationals are counted twice, once for each nationality. Former Soviet Union appears under Russia. | |||
Sources: Nobelprize and UN Population Division