areppim: information, pure and simple

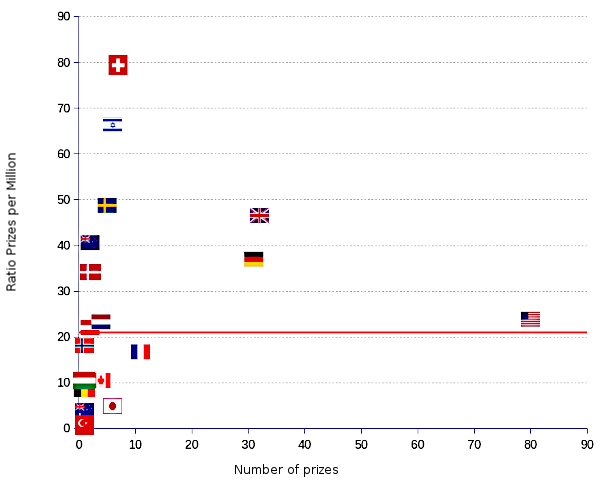
Notwithstanding their small size, countries like Switzerland, Israel, and Sweden sit at the top of the ranking, with per capita indexes of 78, 64 and 48 respectively, or several fold better than the median 14 (the average value of 21 is shown by the red line in the chart). Tiny New Zealand and Denmark sneak into the top ten places. Those countries have an established reputation in the chemistry science, supported by a wealth of fine research facilities and first-rate universities, the whole with strong links to well established industries. Other traditional economic powers such as the United Kingdom, Germany, the Netherlands and the United States appear in the top tier.
![]() Take a look at the complete list of Nobel prizes for chemistry
Take a look at the complete list of Nobel prizes for chemistry
| Country | Number ¹ | Population 2024 | Per capita |
|---|---|---|---|
| (millions) | (number/millionx100) | ||
| Argentina | 1 | 47.2 | 2.1 |
| Australia | 1 | 26.9 | 3.7 |
| Austria | 2 | 9.1 | 22.0 |
| Belgium | 1 | 11.8 | 8.5 |
| Canada | 4 | 39.3 | 10.2 |
| China | 1 | 1,457.9 | 0.1 |
| Czechia | 1 | 10.8 | 9.3 |
| Denmark | 2 | 5.9 | 33.9 |
| Egypt | 1 | 111.7 | 0.9 |
| Finland | 1 | 5.6 | 18.0 |
| France | 11 | 66.1 | 16.7 |
| Germany | 31 | 83.5 | 37.1 |
| Hungary | 1 | 9.5 | 10.5 |
| Israel | 6 | 9.3 | 64.4 |
| Italy | 1 | 59.9 | 1.7 |
| Japan | 6 | 124.0 | 4.8 |
| Netherlands | 4 | 17.3 | 23.1 |
| New Zealand | 2 | 5.0 | 39.9 |
| Norway | 1 | 5.7 | 17.7 |
| Russia | 2 | 145.1 | 1.4 |
| Sweden | 5 | 10.4 | 48.1 |
| Switzerland | 7 | 8.9 | 78.3 |
| Tunisia | 1 | 12.3 | 8.1 |
| Turkey | 1 | 86.7 | 1.2 |
| United Kingdom | 33 | 69.3 | 47.6 |
| United States | 82 | 340.4 | 24.1 |
| Total | 209 | ||
| Median | 13.6 | ||
| Average | 20.5 | ||
| ¹ Double nationals are counted twice, once for each nationality. Former Soviet Union appears under Russia.. Former Czechoslovakia appears under Czechia. | |||
Sources: Nobelprize and UN Population Division