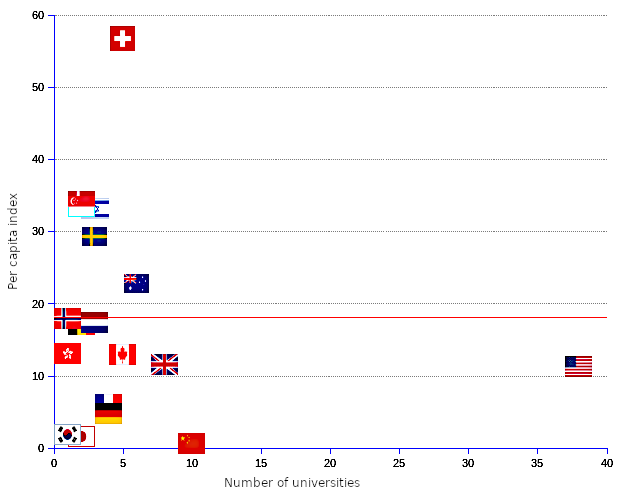
2023 Academic Ranking of World Universities
Per Capita Ranking of Countries in the Top 100

Per capita Index

| Country | Number in the top 100 | Population (million) 2023 | Index* |
|---|
| Australia | 7 | 26.1 | 26.9 |
| Belgium | 2 | 11.7 | 17.1 |
| Canada | 5 | 38.4 | 13.0 |
| China | 8 | 1,448.5 | 0.6 |
| China-Hong Kong | 1 | 7.6 | 13.2 |
| Denmark | 2 | 5.8 | 34.3 |
| Finland | 1 | 5.6 | 18.0 |
| France | 4 | 65.6 | 6.1 |
| Germany | 4 | 83.9 | 4.8 |
| Israel | 3 | 8.9 | 33.6 |
| Japan | 2 | 125.6 | 1.6 |
| Netherlands | 3 | 17.2 | 17.4 |
| Norway | 1 | 5.5 | 18.1 |
| Singapore | 2 | 5.9 | 33.6 |
| South Korea | 1 | 51.3 | 1.9 |
| Sweden | 3 | 10.2 | 29.4 |
| Switzerland | 4 | 8.8 | 45.6 |
| United Kingdom | 8 | 68.5 | 11.7 |
| United States | 39 | 334.8 | 11.6 |
| Total | 100 | | |
| Average | | | 17.8 |
| Median | | | 17.1 |
| * Per capita ratio of number of universities divided by the population in millions, multiplied by 100. |
Source: Institute of Higher Education, Shanghai, and World Population Prospects 2019, United Nations: POP/DB/WPP/Rev.2019/POP/F01-1.
