areppim: information, pure and simple

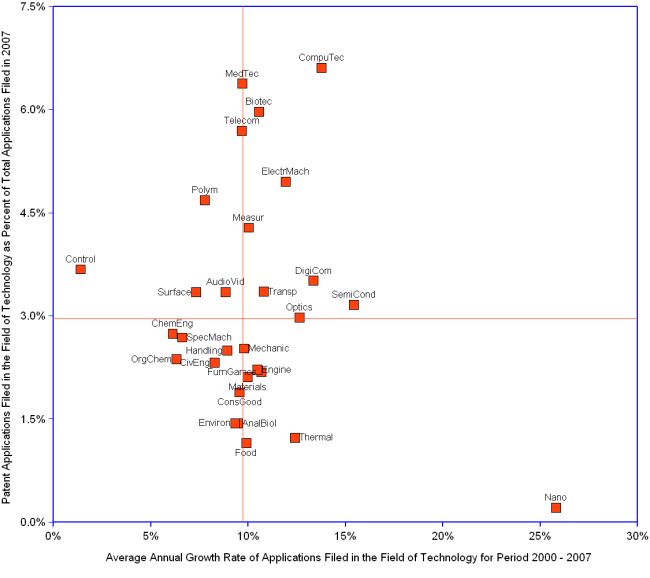
Patent applications favour leading edge fields such as Computer technology (6.6% of total applications in 2007), Medical technology, Biotechnology and Telecommunications (median = 2.74%, orange horizontal line). The technologies of the future may well be those where the average growth of filed applications is higher: Micro-structural and nano-technology (25.8% between 2000 and 2007), Semiconductors, Computer technology and Digital communication (median = 9.78%, orange vertical line).
| Field of Technology (Set of higher ranking technologies) |
Short Code | Average Annual Growth 2000-2007 | Share of Total Applications ² |
|---|---|---|---|
| Micro-structural and nano-technology | Nano | 25.8% | 0.2% |
| Semiconductors | SemiCond | 15.4% | 3.2% |
| Computer technology | CompuTec | 13.8% | 6.6% |
| Digital communication | DigiCom | 13.4% | 3.5% |
| Optics | Optics | 12.6% | 3.0% |
| Thermal processes and apparatus | Thermal | 12.4% | 1.2% |
| Electrical machinery, apparatus, energy | ElectrMach | 11.9% | 4.9% |
| Transport | Transp | 10.8% | 3.4% |
| Furniture, games | FurnGames | 10.7% | 2.2% |
| Biotechnology | Biotec | 10.6% | 6.0% |
| Engines, pumps, turbines | Engine | 10.5% | 2.2% |
| Measurement | Measur | 10.0% | 4.3% |
| Materials, metallurgy | Materials | 10.0% | 2.1% |
| Food chemistry | Food | 9.9% | 1.2% |
| Mechanical elements | Mechanic | 9.8% | 2.5% |
| Medical technology | MedTec | 9.7% | 6.4% |
| Telecommunications | Telecom | 9.7% | 5.7% |
| Other consumer goods | ConsGood | 9.6% | 1.9% |
| Analysis of biological materials | AnalBiol | 9.4% | 1.4% |
| Environmental technology | Environ | 9.3% | 1.4% |
| Macromolecular chemistry, polymers | Polym | 7.8% | 4.7% |
| Control | Control | 1.4% | 3.7% |
| Audio-visual technology | AudioVid | 8.8% | 3.3% |
| Surface technology, coating | Surface | 7.3% | 3.3% |
| Chemical engineering | ChemEng | 6.1% | 2.7% |
| Other special machines | SpecMach | 6.6% | 2.7% |
| Handling | Handling | 8.9% | 2.5% |
| Organic fine chemistry | OrgChem | 6.3% | 2.4% |
| Civil engineering | CivEng | 8.3% | 2.3% |
| ¹ Include only international patent applications filed under the PCT (Patent Cooperation Treaty). Do not include other national or regional applications. | |||
| ² The total number of PCT applications reported by field of technology is greater than the total number of PCT applications published by WIPO, because patent documents may record multiple classification classes. | |||