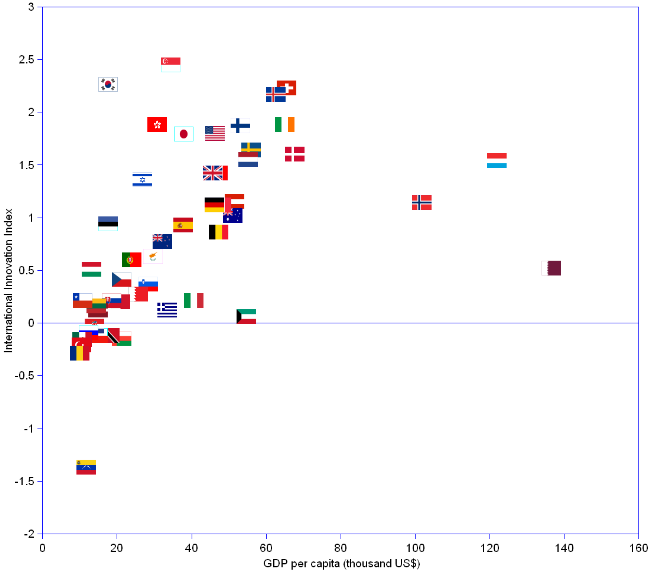

Innovation, as measured by the International Innovation Index, looks like something that the poor cannot afford. Most of the top ranking innovative countries enjoy pretty comfortable GDP per capita. The poor do not rank well. However, money is not all. Some countries have lush revenues and concomitant mediocre innovation scores. This is the case of Qatar or Kuwait, proving that living on a rent may not be conducive to innovative high performance.
International Innovation Index | |||||
Rank | Country | Overall Score (2009) ¹ | Population 2008 | GDP 2008 | GDP per capita |
| 1 | Qatar | 0.52 | 856 | 116.9 | 137 |
| 2 | Luxembourg | 1.54 | 472 | 57.6 | 122 |
| 3 | Norway | 1.14 | 4,727 | 481.1 | 102 |
| 4 | Denmark | 1.6 | 5,453 | 369.6 | 68 |
| 5 | Switzerland | 2.23 | 7,512 | 492.6 | 66 |
| 6 | Ireland | 1.88 | 4,380 | 285.0 | 65 |
| 7 | Iceland | 2.17 | 303 | 19.0 | 63 |
| 8 | Sweden | 1.64 | 9,160 | 512.9 | 56 |
| 9 | Netherlands | 1.55 | 16,450 | 909.5 | 55 |
| 10 | Kuwait | 0.06 | 2,919 | 159.7 | 55 |
| 11 | Finland | 1.87 | 5,293 | 281.2 | 53 |
| 12 | Austria | 1.15 | 8,391 | 432.4 | 52 |
| 13 | Australia | 1.02 | 20,951 | 1,069.0 | 51 |
| 14 | France | 1.12 | 61,946 | 2,978.0 | 48 |
| 15 | Belgium | 0.86 | 10,480 | 495.4 | 47 |
| 16 | Canada | 1.42 | 33,170 | 1,564.0 | 47 |
| 17 | United States | 1.8 | 308,798 | 14,330.0 | 46 |
| 18 | Germany | 1.12 | 82,534 | 3,818.0 | 46 |
| 19 | United Kingdom | 1.42 | 61,019 | 2,787.0 | 46 |
| 20 | Italy | 0.21 | 58,946 | 2,399.0 | 41 |
| 21 | Japan | 1.79 | 127,938 | 4,844.0 | 38 |
| 22 | Spain | 0.93 | 44,593 | 1,683.0 | 38 |
| 23 | Singapore | 2.45 | 4,490 | 154.5 | 34 |
| 24 | Greece | 0.12 | 11,172 | 373.5 | 33 |
| 25 | New Zealand | 0.77 | 4,215 | 135.7 | 32 |
| 26 | Hong Kong SAR | 1.88 | 7,279 | 223.8 | 31 |
| 27 | Cyprus | 0.63 | 864 | 25.6 | 30 |
| 28 | Slovenia | 0.37 | 2,002 | 57.0 | 28 |
| 29 | Israel | 1.36 | 7,045 | 188.7 | 27 |
| 30 | Bahrain | 0.27 | 766 | 19.7 | 26 |
| 31 | Portugal | 0.6 | 10,662 | 255.5 | 24 |
| 32 | Czech Republic | 0.41 | 10,183 | 217.2 | 21 |
| 33 | Oman | -0.15 | 2,651 | 56.3 | 21 |
| 34 | Malta | 0.2 | 408 | 8.6 | 21 |
| 35 | Slovakia | 0.21 | 5,392 | 100.6 | 19 |
| 36 | Saudi Arabia | -0.12 | 25,293 | 467.7 | 18 |
| 37 | Trinidad and Tobago | -0.12 | 1,338 | 24.2 | 18 |
| 38 | Korea, Republic of | 2.26 | 48,388 | 857.5 | 18 |
| 39 | Estonia | 0.94 | 1,331 | 23.5 | 18 |
| 40 | Latvia | 0.12 | 2,265 | 33.9 | 15 |
| 41 | Poland | -0.12 | 38,022 | 567.4 | 15 |
| 42 | Lithuania | 0.16 | 3,371 | 48.8 | 14 |
| 43 | Croatia | -0.03 | 4,550 | 64.0 | 14 |
| 44 | Hungary | 0.51 | 10,000 | 131.4 | 13 |
| 45 | Russian Federation | -0.09 | 141,780 | 1,757.0 | 12 |
| 46 | Venezuela | -1.37 | 28,122 | 331.8 | 12 |
| 47 | Chile | 0.21 | 16,803 | 181.5 | 11 |
| 48 | Mexico | -0.16 | 107,801 | 1,143.0 | 11 |
| 49 | Turkey | -0.21 | 75,830 | 798.9 | 11 |
| 50 | Romania | -0.29 | 21,344 | 213.9 | 10 |
| ¹ 2009 overall innovation index calculated by the Manufacturing Institute. | |||||
| ² GDP at official exchange rate, 2008 estimate | |||||
Sources: see Manufacturing Institute for the innovation index, United Nations Population Division for population data, and CIA - The World Factbook for GDP estimates.