|
|
|
Calculators |
Technotes Blog |
Sports |
Personal Health |
Science, Technology & Culture |
Economy |
Society |
Nature |
|||||
| | Finance | Production | Trade | Mobility | | ||||||||||||
You are here: areppim > Economy
Economy & Finance charts
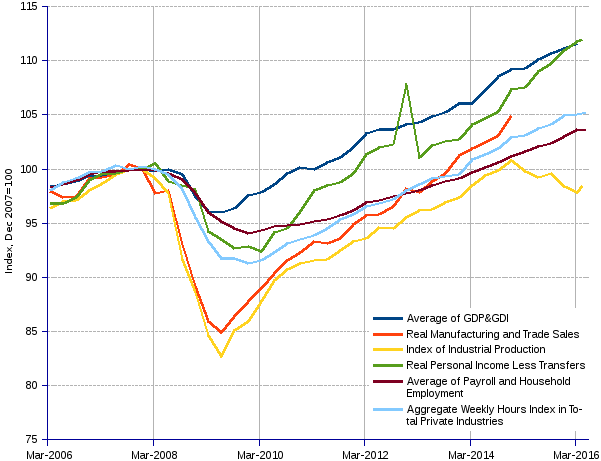
US Business Cycles, 2006-2016
The US real economy has followed a jumpy course since 2006. Everyone, and not only in the United States but everywhere, is well aware of the deleterious consequences of the sub-prime triggered financial crisis of 2008 that quickly degenerated into an economic worldwide debacle, hitting most families and individuals in their flesh and bones.
Measuring the magnitude of the crash in terms of such a high-level aggregate as GDP (gross domestic product) falls quite short of sens...

_________________________________________________________________
Country rankings and trends in economy and finance
– charts, graphs & tables
Finance
External debt, debt to GDP, debt to exports debt to reserves, debt to fiscal revenue, sovereign debt, US federal budget, deficit and debt, receipts in real dollars, spending in real dollars, US corporate performance : profits, dividends, reserves and taxes, company bankruptcies .
Production
World cereals production per capita, production yields, areas harvested, China and India cereals production, oil supply and demand, oil prices, oil production and reserves, lifetime of oil reserves.
Trade
World merchandise exports & imports, major exporters/importers, evolution of trade as percent of WGP, trade balance as percent of GDP, current accounts by economic zones.
Mobility
Tourism worldwide, trends and forecasts of tourist arrivals and tourism receipts, biggest tourism spenders, motor vehicle production, ranking of car makers, car production forecasts.
![]() Clear up any doubt by checking the definition of terms in our Glossary.
Clear up any doubt by checking the definition of terms in our Glossary.
Custom Search
Featured stats