areppim: information, pure and simple

To win on tourism you need more than a little bit of luck. Portugal had its lucky days – if ever a deluge of tourists may be seen as a good fortune. Since 2015 international tourists became uneasy after hundreds of bystanders lost their lives in a string of highly visible terrorist attacks spreading over a number of important destinations, including Paris (Charlie Hebdo on 7 January 2015, and Bataclan on 13 November 2015), Tunis (Bardo National Museum, 18 March 2015), Ankara (bombing, 10 October 2015), Sinai, Egypt (bombing, 31 October 2015), Nice (truck attack, 14 July 2016), Berlin (truck attack, 19 December 2016), Manchester (Arena bombing, 22 May 2017), London (car attack, London Bridge, 3 June 2017), Barcelona (van attack, 17 August 2017).
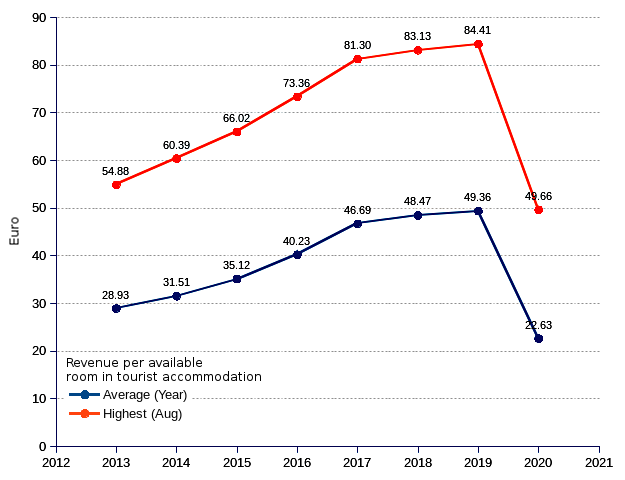
Portuguese tourism entrepreneurs seized the opportunity, offering the crowds an affordable alternative of a safe haven, with zero terrorism, on top of the traditional 3-S (sea, sand and sun) and a gourmet’s choice of inexpensive first grade wines. The industry made the required investments, and succeeded in increasing the total revenue in tourist accommodation by more than twofold (average annual growth of 13.36% or 9.32% per available room). But the wheel of luck never stops spinning. The new coronavirus turned the Portuguese edifice upside down in just a few weeks. The revenue per room still grew year-on-year in January and February, but it tumbled to the abyss in March (-56.83%) and finished the year at less than half of the 2019 value (-54.15%).The ominous collapse of tourist accommodation revenues sweeps away any remaining hopes of an upswing of the tourism business in the foreseeable future.
Until it recovers to anything near the pre-Covid19 situation, many moons will cross the skies, and many tourism entrepreneurs will go bust. Like gambling, tourism is full of surprises.
The irresistible growth of tourism lodgings, coupled with the sudden vanishing of tourists raises an issue that looks terribly familiar to all manufacturing operations managers: how to match workload and capability? There is no easy solution. Excess capacity means idle capital, which means operating losses that can quickly lead to bankruptcy. Excess workload means inability to deliver, which causes customers to start looking elsewhere, thus increasing the competition’s market share, a huge threat to one’s business. The Covid19 pandemic has just placed Portugal’s tourism industry between the hammer of scanty tourists and the anvil of plentiful rooms.
In its 17 June 2020 report, INE (Portugal’s national institute of statistics) acknowledges that tourism activity had almost null expression as of April 2020.
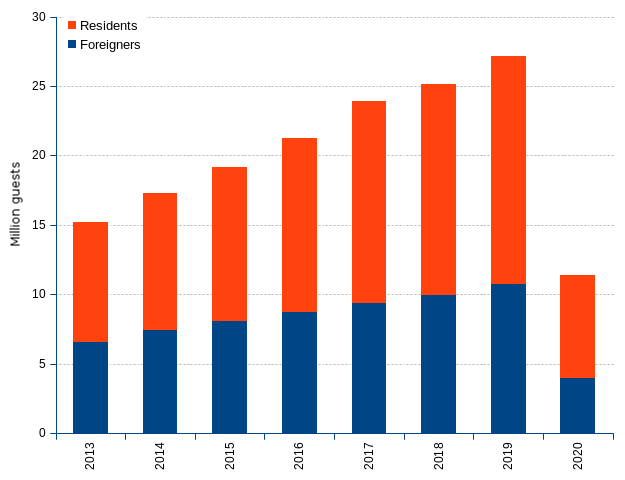
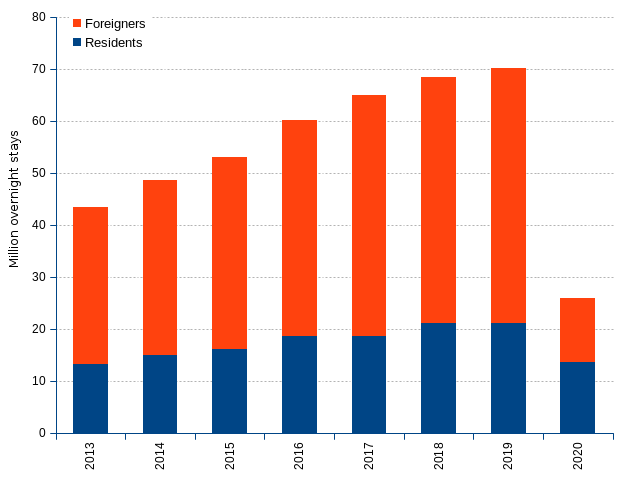
The tourist accommodation sector registered 10,5 million guests and 26 million overnight stays in 2020, corresponding to year-on-year rates of change of -61% and -63% respectively.
Tourists do not show up. We lack specific data on international tourist arrivals by land, sea or air. However, the evaluation of passenger activity in the Portuguese airports points to a brutal collapse of the numbers of international passengers. The flow of air travelers in Portuguese airports shrunk by -69.4% compared to 2019. The iterative and disorderly closing of land borders, the grounding of passenger aircrafts, and the quarantine imposed on cruise and other passenger vessels should only rarefy the inflow of tourists even further.
The result on the stays of guests in tourist establishments takes dramatic proportions. From 2013 to 2019 the number of guests grew by more than 78 percent, at the average annual rate of 10.1 percent. Foreigners contributed with the larger portion, with a growth of 90 percent at the annual rate of 11.3 percent. The year 2020, compared with 2019, saw a steep overall decline of -61 percent, and an even steeper -75.7 percent fall for foreigners.
Less guests led to a decrease of overnight stays. The year 2020 registered a -63% fall of the total stays, of which a -74.9% change for foreigners' stays. News in the papers digressed about residents having rescued the national tourism business by occupying the rooms left vacant by foreigners. First, this is not a fact, as the table shows. Then, it is conceivable that the handful of nationals that had planned their vacations abroad, decided to switch to a domestic option — that's as much money that doesn't go out of the country. But it surely does not bring any fresh revenues from foreigners, and does not advance the national current account by one iota.
From 2013 through 2019, the number of tourist accommodation facilities increased significantly, ahead of the total of tourists. The number of establishments more than doubled, the rooms available increased by 33.2% (annual average 4.9%) and the beds by 35.9% (annual average 5.2%). March 2020 acted like a vacuum cleaner and by April the cornucopia of rooms could only show empty beds.
The combination of elusive tourists and countless beds froze the business altogether, tearing to shreds the revenue per room. The episode should ring a bell about the inappropriateness of rendering mass tourism a pillar of the economy. Mass tourism is to blame for countless damages, including degradation of natural habitats, endangering the integrity of the sites, causing the loss of biodiversity, making urban grounds noisy and dirty, reducing affordable housing for locals, increasing prices, inducing wild speculation and straining municipal budgets. So much so that many destinations have taken steps to curb tourist arrivals. Barcelona, Amsterdam or Venice have placed constraints on tourist traffic in selected neighborhoods. The Easter Island, the Galapagos, the Mont-Blanc have curbed the number of visitors. Santorin (Greece), Bhutan, Boracay (Philippines) placed controls on the admission of tourists.
The unbridled development of vacation homes, holiday villages and tourist accommodations become a nightmare when, short of tourists, the homes remain closed, the villages deserted, the accommodations empty and the beds cold. Local municipalities see their tax revenues shrink, while maintenance expenses (roads and tracks, sewage, gardening, lighting, water supply, security, waste disposal, etc.) keep rising. Ultimately the system crumbles, leaving behind bankrupt administrations, derelict buildings and phantom holiday villages – as one that you may have tripped upon while loitering up in the mountains or by the seaside.
Sustainable tourism is an oxymoron. Tourism is viable only if practiced with discretion and restraint, but need or greed push it irrevocably up to massive proportions. What could be a source of enriching and pleasurable experiences, becomes a scourge. We should be well advised to get inspiration from the Swiss people who, in 2012, decided to set to 20% the limit of vacation homes in the communes, in order to prevent the mitage des montagnes
(urban sprawl in the mountains). The alternative is to allow catastrophic events such as the Covid19 to take care of the issue the hard way.

