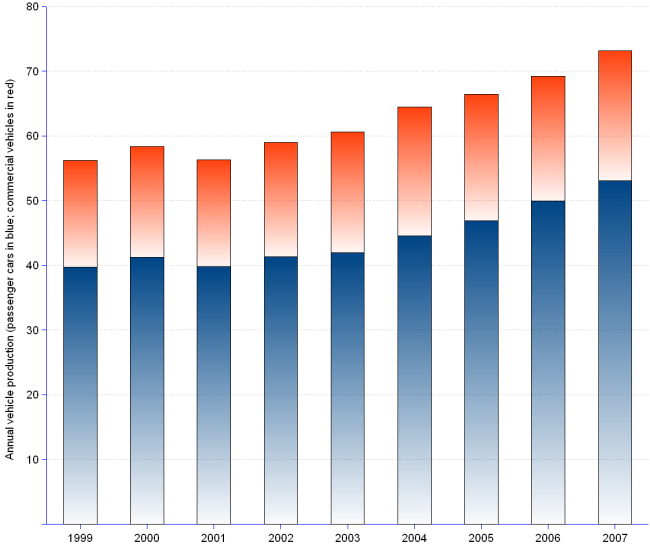
In spite of ups and downs, world manufacturers churned 30% more motor vehicles in 2007 than in 1999. The increase has been driven by passenger car production that grew by 33% during the period, against 27% for commercial vehicles. In 2007, the share of cars in the total motor vehicle production reached 73% (increasing by 3% since 1999) while the share of commercial vehicles lowered to 27% (decreasing by 6% since 1999).
Motor Vehicle Production Worldwide | |||
Year | Passenger Cars | Commercial Vehicles | Total |
| 1999 | 39.760 | 16.499 | 56.259 |
| 2000 | 41.216 | 17.159 | 58.374 |
| 2001 | 39.826 | 16.479 | 56.305 |
| 2002 | 41.358 | 17.636 | 58.994 |
| 2003 | 41.969 | 18.695 | 60.663 |
| 2004 | 44.554 | 19.942 | 64.496 |
| 2005 | 46.863 | 19.619 | 66.482 |
| 2006 | 49.919 | 19.304 | 69.223 |
| 2007 | 53.049 | 20.103 | 73.153 |
[]
Sources: see International Organization of Motor Vehicle Manufacturers