![]() International Tourist Arrivals : Actual data | World Forecast (S-curve) |
International Tourist Arrivals : Actual data | World Forecast (S-curve) |

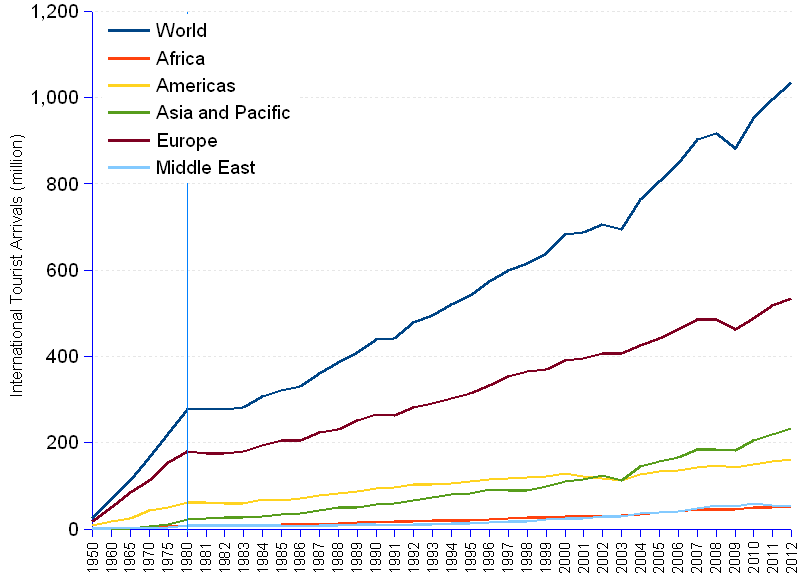
For the first time in 2012, ITA (international tourist arrivals) exceeded the number of 1 billion, reaching 1,035 million, 39 million more than in 2011, pursuing a continuous global growth since 1950, at an annual average rate of 6.2% (doubling time 11.6 years). During this extended period, Asia and the Pacific saw the strongest growth (12.06%), and Americas the lowest (5.08%).
Demand suffered hugely from the financial and economic difficulties experienced in many parts of the world since 2008. Roughly, the growth rates were chopped by half, the world ITA having progressed of 3.07% since 2008, against the 6.17% for the full period since 1950. Demand in Europe and in the Americas grew modestly, and it suffered a negative inflection in the Middle East. Only Asia and the Pacific showed a good average growth of 6.05%. Given the dark prospects of the world economy, it is not likely that tourism demand will soon return to its historical growth rates.
International Tourist Arrivals, 1950-2012¹ | ||||||
Year |
Africa |
Americas |
Asia & Pacific |
Europe |
Middle East |
World |
| 1950 | 0.5 | 7.5 | 0.2 | 16.8 | 0.2 | 25.3 |
| 1960 | 0.8 | 16.7 | 0.9 | 50.4 | 0.6 | 69.3 |
| 1965 | 1.4 | 23.2 | 2.1 | 83.7 | 2.4 | 112.9 |
| 1970 | 2.4 | 42.3 | 6.2 | 113.0 | 1.9 | 165.8 |
| 1975 | 4.7 | 50.0 | 10.2 | 153.9 | 3.5 | 222.3 |
| 1980 | 7.2 | 62.3 | 23.0 | 178.5 | 7.1 | 278.1 |
| 1981 | 8.1 | 62.5 | 24.9 | 175.5 | 7.6 | 278.6 |
| 1982 | 7.6 | 59.7 | 26.0 | 175.3 | 8.3 | 276.9 |
| 1983 | 8.2 | 59.9 | 26.6 | 179.6 | 7.5 | 281.8 |
| 1984 | 8.9 | 67.4 | 29.5 | 193.4 | 7.7 | 306.8 |
| 1985 | 9.7 | 65.1 | 32.9 | 204.3 | 8.1 | 320.1 |
| 1986 | 9.4 | 70.9 | 36.8 | 206.2 | 6.9 | 330.2 |
| 1987 | 9.9 | 76.6 | 42.1 | 223.9 | 7.2 | 359.7 |
| 1988 | 12.6 | 83.0 | 48.7 | 231.6 | 9.1 | 385.0 |
| 1989 | 13.9 | 86.9 | 49.4 | 250.7 | 9.2 | 410.1 |
| 1990 | 15.2 | 92.8 | 56.2 | 265.6 | 9.6 | 439.5 |
| 1991 | 16.3 | 95.3 | 58.0 | 263.9 | 8.9 | 442.5 |
| 1992 | 18.3 | 102.2 | 65.8 | 282.2 | 11.3 | 479.8 |
| 1993 | 18.9 | 102.2 | 72.3 | 290.8 | 11.4 | 495.7 |
| 1994 | 19.3 | 105.1 | 80.1 | 303.1 | 12.1 | 519.8 |
| 1995 | 20.4 | 109.0 | 82.4 | 315.0 | 13.7 | 540.6 |
| 1996 | 22.2 | 114.5 | 90.4 | 332.1 | 15.8 | 575.0 |
| 1997 | 23.2 | 116.2 | 89.7 | 352.9 | 16.7 | 598.6 |
| 1998 | 25.6 | 119.1 | 89.4 | 364.6 | 18.0 | 616.7 |
| 1999 | 27.0 | 121.9 | 98.7 | 370.5 | 21.5 | 639.6 |
| 2000 | 27.9 | 128.2 | 110.6 | 391.0 | 24.4 | 682.0 |
| 2001 | 29.1 | 122.1 | 115.7 | 395.2 | 24.5 | 686.7 |
| 2002 | 30.0 | 116.7 | 124.9 | 407.0 | 28.5 | 707.0 |
| 2003 | 31.6 | 113.1 | 113.3 | 407.1 | 29.5 | 694.6 |
| 2004 | 34.5 | 125.7 | 144.2 | 424.4 | 36.3 | 765.1 |
| 2005 | 37.3 | 133.5 | 155.4 | 441.5 | 39.0 | 806.8 |
| 2006 | 41.4 | 135.8 | 166.8 | 462.1 | 41.4 | 847.0 |
| 2007 | 44.3 | 142.5 | 184.2 | 484.9 | 47.4 | 903.0 |
| 2008 | 44.4 | 147.8 | 184.1 | 485.2 | 55.2 | 917.0 |
| 2009 | 45.9 | 141.7 | 181.1 | 461.7 | 52.8 | 883.0 |
| 2010 | 49.8 | 150.3 | 205.1 | 487.6 | 59.2 | 952.0 |
| 2011 | 49.2 | 156.3 | 218.1 | 517.5 | 55.3 | 996.0 |
| 2012 | 52.3 | 162.1 | 232.9 | 534.8 | 52.6 | 1,035.0 |
| Average annual change rate 1950-2012 | 7.79% | 5.08% | 12.06% | 5.74% | 9.40% | 6.17% |
| Average annual change rate 2008-2012 | 4.18% | 2.34% | 6.05% | 2.46% | -1.2% | 3.07% |
| ¹ Change of time scale: 1-year scale from 1980 onwards. | ||||||


Historical data shows that tourism demand has been suffering from the financial and economic difficulties experienced in many parts of the world since 2008. Nevertheless, it is possible that structural causes, not only the ups and downs of financial crises, are weakening tourism demand, driving it to a slowdown adverse to the expectations that entrepreneurs still place in it.
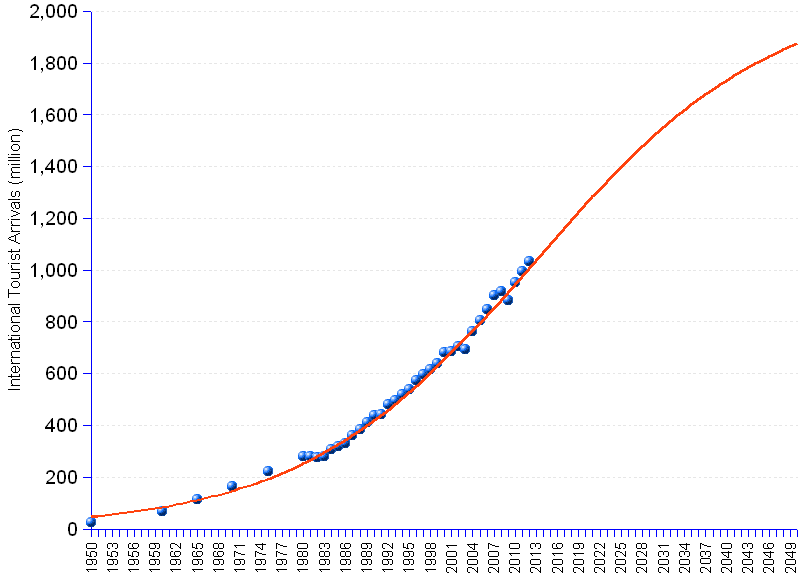
The S-curve forecast purports to assess how demand could evolve in the long run, assuming that the variables that influenced its past keep playing a similar role in the future. The chart shows in blue the historical data until 2012, and in red the logistic function forecast. The forecast line suggests that saturation will be reached at about 2.1 billion tourist arrivals, roughly twice the 2012 level, and that the inflection point, when change rates instead of accelerating, start decelerating, will happen in 2013. This is only one possible scenario among others, but it is worthwhile pondering by whoever delves with the long term strategic decisions in an industry where things are typically lengthy — from building a resort to creating an image.
World International Tourist Arrivals | ||
Year |
World ITA Actuals |
World ITA Forecast |
| (million) | (million) | |
| 1950 | 25.3 | 46 |
| 1951 | 49 | |
| 1952 | 52 | |
| 1953 | 55 | |
| 1954 | 59 | |
| 1955 | 62 | |
| 1956 | 66 | |
| 1957 | 70 | |
| 1958 | 74 | |
| 1959 | 78 | |
| 1960 | 69.3 | 83 |
| 1961 | 88 | |
| 1962 | 93 | |
| 1963 | 99 | |
| 1964 | 104 | |
| 1965 | 112.9 | 110 |
| 1966 | 117 | |
| 1967 | 124 | |
| 1968 | 131 | |
| 1969 | 138 | |
| 1970 | 165.8 | 146 |
| 1971 | 155 | |
| 1972 | 164 | |
| 1973 | 173 | |
| 1974 | 183 | |
| 1975 | 222.3 | 193 |
| 1976 | 204 | |
| 1977 | 215 | |
| 1978 | 227 | |
| 1979 | 239 | |
| 1980 | 278.1 | 252 |
| 1981 | 278.6 | 266 |
| 1982 | 276.9 | 280 |
| 1983 | 281.8 | 295 |
| 1984 | 306.8 | 310 |
| 1985 | 320.1 | 326 |
| 1986 | 330.2 | 343 |
| 1987 | 359.7 | 361 |
| 1988 | 385.0 | 379 |
| 1989 | 410.1 | 398 |
| 1990 | 439.5 | 418 |
| 1991 | 442.5 | 438 |
| 1992 | 479.8 | 459 |
| 1993 | 495.7 | 481 |
| 1994 | 519.8 | 504 |
| 1995 | 540.6 | 527 |
| 1996 | 575.0 | 551 |
| 1997 | 598.6 | 575 |
| 1998 | 616.7 | 601 |
| 1999 | 639.6 | 627 |
| 2000 | 682.0 | 653 |
| 2001 | 686.7 | 680 |
| 2002 | 707.0 | 708 |
| 2003 | 694.6 | 736 |
| 2004 | 765.1 | 765 |
| 2005 | 806.8 | 794 |
| 2006 | 847.0 | 824 |
| 2007 | 903.0 | 854 |
| 2008 | 917.0 | 884 |
| 2009 | 883.0 | 915 |
| 2010 | 952.0 | 946 |
| 2011 | 996.0 | 977 |
| 2012 | 1,035.0 | 1,008 |
| 2013 | 1,039 | |
| 2014 | 1,070 | |
| 2015 | 1,101 | |
| 2016 | 1,132 | |
| 2017 | 1,163 | |
| 2018 | 1,194 | |
| 2019 | 1,224 | |
| 2020 | 1,254 | |
| 2021 | 1,284 | |
| 2022 | 1,313 | |
| 2023 | 1,342 | |
| 2024 | 1,370 | |
| 2025 | 1,398 | |
| 2026 | 1,425 | |
| 2027 | 1,451 | |
| 2028 | 1,477 | |
| 2029 | 1,503 | |
| 2030 | 1,527 | |
| 2031 | 1,551 | |
| 2032 | 1,574 | |
| 2033 | 1,597 | |
| 2034 | 1,619 | |
| 2035 | 1,640 | |
| 2036 | 1,660 | |
| 2037 | 1,680 | |
| 2038 | 1,699 | |
| 2039 | 1,717 | |
| 2040 | 1,735 | |
| 2041 | 1,752 | |
| 2042 | 1,768 | |
| 2043 | 1,783 | |
| 2044 | 1,798 | |
| 2045 | 1,812 | |
| 2046 | 1,826 | |
| 2047 | 1,839 | |
| 2048 | 1,851 | |
| 2049 | 1,863 | |
| 2050 | 1,874 | |
[]
Sources: UNWTO : World Tourism Barometer, Tourism Highlights.