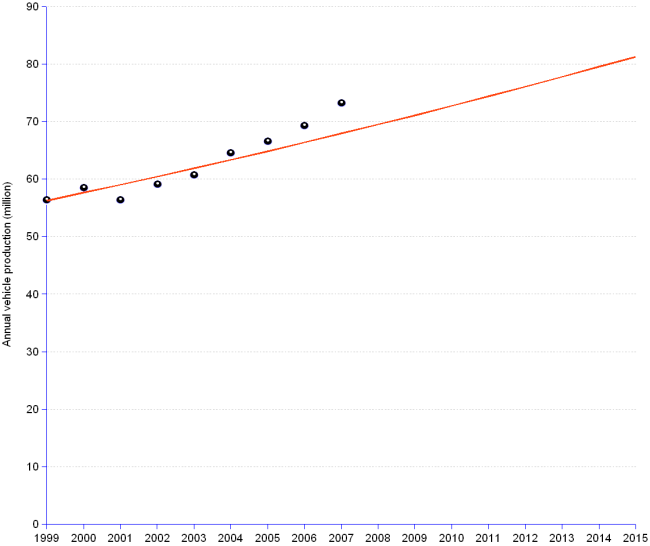
World motor vehicle production increased at an annual average rate of 3% (from 56 in 1999 to 73 million vehicles in 2007). The global economic crisis that erupted in 2008 is putting this trend in jeopardy, knocking car makers down and badly injuring the industry. Authorities in charge of economic policies inject taxpayers' money into plans aimed at putting the industry back on trail and opening the dams to the desired waves of new cars. This may not be a sustainable course of action. A logistic function forecast (which assumes that there is a limit, however high, to the number of cars that mankind can possess) suggests that this approach, if successful, might lead to an annual production of 90 million vehicles in a mere dozen years. Financial costs, scarcity of steal and other raw materials, penury of oil, bloated cities, traffic jammed roads, CO² polluted atmosphere, and a host of other factors say that this scenario is neither desirable, nor likely to come true.
Motor Vehicle Production | ||
Year | Actual Vehicles Produced | Forecast |
| 1999 | 56.26 | 56.26 |
| 2000 | 58.37 | 57.61 |
| 2001 | 56.3 | 59 |
| 2002 | 58.99 | 60.4 |
| 2003 | 60.66 | 61.83 |
| 2004 | 64.5 | 63.29 |
| 2005 | 66.48 | 64.77 |
| 2006 | 69.22 | 66.28 |
| 2007 | 73.15 | 67.82 |
| 2008 | 69.38 | |
| 2009 | 70.96 | |
| 2010 | 72.57 | |
| 2011 | 74.21 | |
| 2012 | 75.87 | |
| 2013 | 77.56 | |
| 2014 | 79.27 | |
| 2015 | 81.01 | |
| 2016 | 82.78 | |
| 2017 | 84.56 | |
| 2018 | 86.38 | |
| 2019 | 88.21 | |
| 2020 | 90.07 | |
[]
Sources: see International Organization of Motor Vehicle Manufacturers