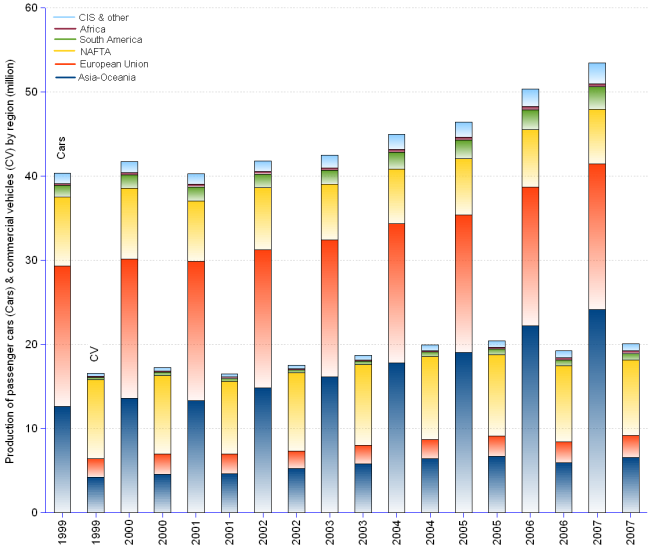
Number of vehicle production by region illustrate the industrial rise of South-East Asia and the fall of North America and Europe. In 1999, Asia-Oceania manufactured 30% of all motor vehicles produced in the world (32% of passenger cars). The share grew to 42% in 2007 (45% for cars), driven mainly by the emergence of the China manufacturing capability. Meanwhile, the share of North America - practically USA - came down from 31% to 21% (only 12% for cars). The European Union shows also a downward trend, however less dramatic than the American one, as its share of 33% in 1999 (42% of cars) shrunk to 27% in 2007 (33% for cars). In the motor vehicle industry too, China asserts itself as the planet's workshop [tall columns: passenger cars; short columns: commercial vehicles].
Motor Vehicle Production by Region | ||||||||
Asia-Oceania | European Union | NAFTA¹ | South America | Africa | Other | Total² | ||
| 1999 | Cars | 12.61 | 16.66 | 8.26 | 1.33 | 0.26 | 1.22 | 39.76 |
| Commercial Vehicles | 4.22 | 2.16 | 9.38 | 0.32 | 0.13 | 0.31 | 16.5 | |
| Total | 16.83 | 18.83 | 17.63 | 1.66 | 0.39 | 1.54 | 56.26 | |
| 2000 | Cars | 13.58 | 16.57 | 8.37 | 1.59 | 0.27 | 1.33 | 41.22 |
| Commercial Vehicles | 4.53 | 2.39 | 9.33 | 0.43 | 0.15 | 0.38 | 17.16 | |
| Total | 18.11 | 18.97 | 17.7 | 2.02 | 0.42 | 1.71 | 58.37 | |
| 2001 | Cars | 13.28 | 16.6 | 7.15 | 1.67 | 0.31 | 1.26 | 39.83 |
| Commercial Vehicles | 4.61 | 2.32 | 8.64 | 0.38 | 0.16 | 0.34 | 16.48 | |
| Total | 17.88 | 18.91 | 15.8 | 2.05 | 0.46 | 1.6 | 56.3 | |
| 2002 | Cars | 14.8 | 16.44 | 7.35 | 1.63 | 0.3 | 1.27 | 41.36 |
| Commercial Vehicles | 5.2 | 2.08 | 9.37 | 0.32 | 0.15 | 0.39 | 17.64 | |
| Total | 20 | 18.52 | 16.71 | 1.95 | 0.45 | 1.66 | 58.99 | |
| 2003 | Cars | 16.1 | 16.32 | 6.62 | 1.61 | 0.32 | 1.46 | 41.97 |
| Commercial Vehicles | 5.76 | 2.23 | 9.62 | 0.38 | 0.15 | 0.52 | 18.69 | |
| Total | 21.86 | 18.56 | 16.24 | 2 | 0.47 | 1.98 | 60.66 | |
| 2004 | Cars | 17.77 | 16.55 | 6.47 | 2.03 | 0.34 | 1.82 | 44.55 |
| Commercial Vehicles | 6.39 | 2.32 | 9.81 | 0.54 | 0.17 | 0.68 | 19.94 | |
| Total | 24.17 | 18.87 | 16.28 | 2.58 | 0.51 | 2.49 | 64.5 | |
| 2005 | Cars | 19 | 16.39 | 6.67 | 2.19 | 0.37 | 1.82 | 46.86 |
| Commercial Vehicles | 6.68 | 2.43 | 9.67 | 0.66 | 0.21 | 0.74 | 19.62 | |
| Total | 25.69 | 18.8 | 16.32 | 2.85 | 0.59 | 2.56 | 66.48 | |
| 2006 | Cars | 22.17 | 16.5 | 6.85 | 2.36 | 0.39 | 2.11 | 49.92 |
| Commercial Vehicles | 5.9 | 2.49 | 9.03 | 0.69 | 0.29 | 0.8 | 19.3 | |
| Total | 28.07 | 18.99 | 15.88 | 3.04 | 0.68 | 2.91 | 69.22 | |
| 2007 | Cars | 24.11 | 17.32 | 6.48 | 2.74 | 0.34 | 2.48 | 53.05 |
| Commercial Vehicles | 6.52 | 2.63 | 8.98 | 0.78 | 0.29 | 0.88 | 20.1 | |
| Total | 30.63 | 19.95 | 15.45 | 3.52 | 0.64 | 3.36 | 73.15 | |
| ¹ NAFTA: USA, Canada and Mexico. | ||||||||
| ² Discrepancies between the total and the sum of the parts are due to the way the source handles double counts. | ||||||||
[]
Sources: see International Organization of Motor Vehicle Manufacturers