areppim: information, pure and simple

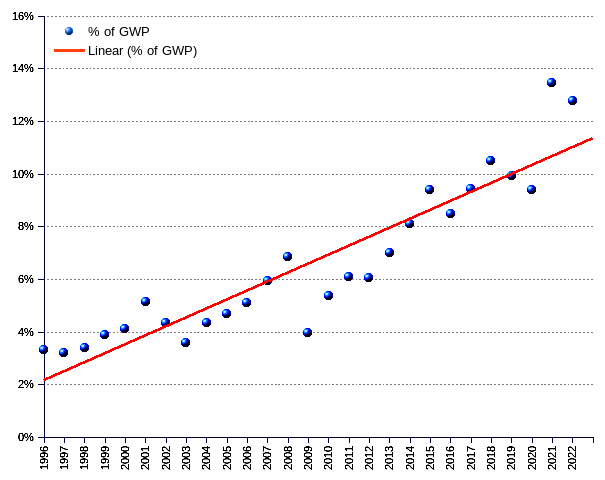
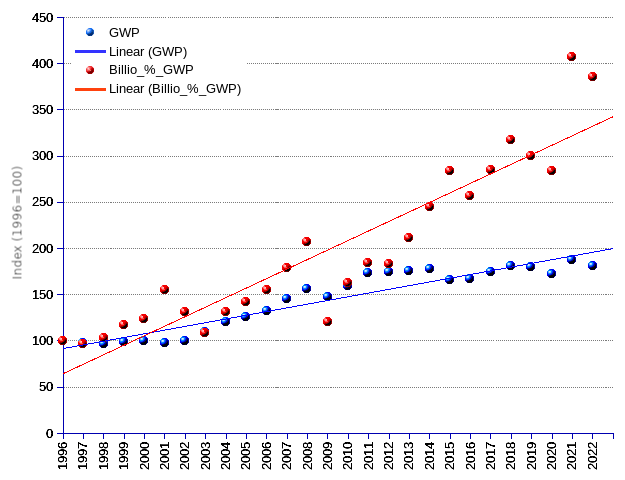
Don’t pity the billionaires! They had a bad year 2022, but only compared with 2021. Otherwise, they fared better than ever. The world billionaires aggregate net worth as percent of GWP (gross world product). At that time, they were a gang of 423, weighing 1,825 US$B, or the equivalent to 3.3% of an estimated 55.2 US$T GWP. They multiplied to become a crowd of 1,825, worth of 12,700 US$B or 12.8% of an estimated GWP of 99.6 US$T in 2022 (all values in constant 2012 US$). In this race of a sort, billionaires took the fast lane, growing at an average annual rate of 7.7%, while GWP strolled at an yearly rate of 2.3%.
To get a feeling of the phenomenon, let us use a silly metaphor. In 1996 the whole 5.8 billion world population should have to work 8 solid days to produce an output equivalent to the total net worth of the then existing billionaires. A quarter of a century later, in 2022, the now 7.95 billion population should have to complete 32 workdays, four fold as much, to match the wealth of the contemporary 2,668 billionaires.
Contrary to their obnoxious reputation, ordinary workers, simple folks like you and me, are astoundingly prodigal. Non content with letting go between one third and one half of their output to the tax office, they still provide extra hard work to make billionaires richer. This is a fact. By letting the billionaires’ share grow from 3.3% to 12.8% of GWP, the common people allowed billionaires to deflect to their balance sheets an increasingly larger cut of the world's output.
How much did they lose in this zero-sum game? By lack of comparable data, we shall use a proxy, in this instance the U.S. statistics on households and individual salary and wage-earners. The numbers give serious reasons for concern. The U.S. disposable personal income per capita progressed by a shy 1.66% per annum during the same period, lagging behind GDP (gross domestic product) growth (2.3% as above mentioned). In parallel, the household debt grew at an annual rate of 2.78 %, thus outpacing GDP. To put it simply, worker compensation has been allocated a declining share of the GDP cake, inducing households to incur debt at a faster rate than the economy growth.
Ours is a magnificent era of wealth accumulation. The world’s gross output grows at an average rate of 2.3% per annum, allowing it to double in size every 30 years. Not bad, but it fails to meet the billionaires’ expectations. They don’t aim just to be wealthy. They are intent on becoming wealthier, and much faster than what the world’s growth should allow. So far, they have good reasons to feel proud of their performance. Their percent share of GWP achieved a 5.3% average growth rate, allowing their slice of the cake to double not in 30, but in a much faster 14-year period. Is there a limit to their entitlement?

The widening differential between the world’s gross output and the billionaires’ collective worth finds its reflection on the deepening inequalities between the rich and the poor. Wile the lucky ones keep climbing sky-high, the ordinary folks get impoverished every passing day, and are caught in the quicksand of insolvency.
The super-rich and their clerks claim that a dollar to the rich is money that trickles down to the poor, through consumption or investment. This is pure baloney. The accumulated wealth is hardly channeled to job and income-generating investments. Instead, it is vastly used to play weird financial games aimed at increasing the value of the stock holdings. The impact on the quality of life of the average person is devastating: unemployment, precarious jobs, lower and insecure income, poisonous indebtedness, economic dependency, failed public services, crumbling infrastructure, etc. Not to speak of the deleterious ecological effects of consumerism, or the abrasive social consequences of the inequality chasm between the 2,668 world billionaires, and the legions of people including the 7% of employed population below the international poverty line of US$1.90 per day, the 23% of youth (aged 15-24 years) not in education, employment or training, or the 12% prevalence of severe food insecurity.
Crises exist indeed, and they are an affliction for common people. At this very moment, the social and economic consequences of the COVID-19 pandemic are still looming. The on-going conflict in Ukraine, the cold-war tensions triggered by the imperial longings of the USA, and the striving to build a new multi-polar world order, all these factors compound a scenery bleak enough. For the billionaire 0.000034% of the world population, though, crises are a flash in the pan, nay, a convenient lever to push their fortunes further up. Both the 2001 dot.com burst and the 2008 global financial meltdown have been quickly outdistanced. The 2015 depression caused murderous commotion among world billionaires, to an extent unparalleled since 2009. But the course returned to normalcy in 2017. The 2019 pandemic reshuffled the billionaire list, but 2021 shone brighter than ever for the extra-rich. The financial and economic impact of the 2022 geopolitical crisis rocked the boat again, but the billionaire gang did not go keel over.
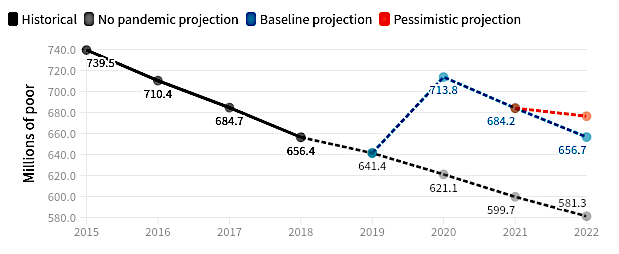
Billionaires, as a caste, have demonstrated their power to stand the test virtually unscathed. But the situation dynamics may prove unsustainable. On the one hand, a minute group of individuals who owned 3% of GWP in 1996, 13% in 2022, likely more than 25% in 2035, or 50% in 2050… On the other hand, a huge crowd comprising 680 million of extremely poor people, 215 million of unemployed, 470 million of underutilized labor… The former will be intent on preserving their privileges. They will never yield. The latter are already saying loud and clear that enough is enough. When they decide that they won’t take it anymore, the clash will be inevitable and brutal. The issue may come – hopefully – as a bitter pill for the evangelists of the Might is Right
religion.
 "
"
| Year | World Billionaires | GDP (gross world product) ¹ | Billionaire Net Worth as percent of GDP | |||||||
|---|---|---|---|---|---|---|---|---|---|---|
| Number | Net Worth | Average | Median ³ | (trillion US$ current) | (trillion US$ constant, 2012 =100) | |||||
| (billion US$ current) | (billion US$ constant, 2012=100) ² | (billion US$ current) | (billion US$ constant, 2012=100) | (billion US$ current) | (billion US$ constant, 2012=100) | |||||
| 1996 | 423 | 1,049.5 | 1,825 | 2.5 | 4.3 | 1.9 | 3.0 | 31.742 | 55.2 | 3.31% |
| 1997 | 224 | 1,010.0 | 1,727 | 4.5 | 7.7 | 2.9 | 4.5 | 31.628 | 54.1 | 3.19% |
| 1998 | 209 | 1,069.1 | 1,807 | 5.1 | 8.6 | 3.3 | 5.0 | 31.546 | 53.3 | 3.39% |
| 1999 | 298 | 1,270.9 | 2,119 | 4.3 | 7.1 | 2.9 | 4.3 | 32.745 | 54.6 | 3.88% |
| 2000 | 322 | 1,386.1 | 2,260 | 4.3 | 7.0 | 2.9 | 4.3 | 33.840 | 55.2 | 4.10% |
| 2001 | 538 | 1,728.6 | 2,756 | 3.2 | 5.1 | 1.9 | 2.8 | 33.624 | 53.6 | 5.14% |
| 2002 | 472 | 1,515.5 | 2,379 | 3.2 | 5.0 | 1.8 | 2.6 | 34.918 | 54.8 | 4.34% |
| 2003 | 476 | 1,403.3 | 2,160 | 2.9 | 4.5 | 1.7 | 2.4 | 39.152 | 60.3 | 3.58% |
| 2004 | 587 | 1,917.2 | 2,874 | 3.3 | 4.9 | 1.9 | 2.6 | 44.124 | 66.1 | 4.35% |
| 2005 | 691 | 2,236.2 | 3,250 | 3.2 | 4.7 | 2.0 | 2.7 | 47.784 | 69.5 | 4.68% |
| 2006 | 793 | 2,645.5 | 3,730 | 3.3 | 4.7 | 2.0 | 2.6 | 51.780 | 73.0 | 5.11% |
| 2007 | 946 | 3,452.0 | 4,739 | 3.6 | 5.0 | 2.1 | 2.6 | 58.349 | 80.1 | 5.92% |
| 2008 | 1,125 | 4,381.0 | 5,902 | 3.9 | 5.2 | 2.2 | 2.7 | 64.121 | 86.4 | 6.83% |
| 2009 | 793 | 2,414.7 | 3,232 | 3.0 | 4.1 | 1.8 | 2.2 | 60.804 | 81.4 | 3.97% |
| 2010 | 1,011 | 3,567.8 | 4,719 | 3.5 | 4.7 | 3.5 | 4.2 | 66.606 | 88.1 | 5.36% |
| 2011 | 1,210 | 4,496.3 | 5,826 | 3.7 | 4.8 | 3.7 | 4.4 | 73.857 | 95.7 | 6.09% |
| 2012 | 1,226 | 4,574.5 | 5,818 | 3.7 | 4.7 | 2.1 | 2.4 | 75.500 | 96.0 | 6.06% |
| 2013 | 1,426 | 5,431.8 | 6,790 | 3.8 | 4.8 | 2.1 | 2.4 | 77.606 | 97.0 | 7.00% |
| 2014 | 1,645 | 6,446.5 | 7,910 | 3.9 | 4.8 | 2.2 | 2.5 | 79.733 | 97.8 | 8.09% |
| 2015 | 1,826 | 7,063.2 | 8,581 | 3.9 | 4.7 | 2.1 | 2.3 | 75.186 | 91.3 | 9.39% |
| 2016 | 1,810 | 6,482.6 | 7,798 | 3.6 | 4.3 | 2.1 | 2.2 | 76.469 | 92.0 | 8.48% |
| 2017 | 2,043 | 7,668.0 | 9,052 | 3.8 | 4.4 | 2.1 | 2.3 | 81.409 | 96.1 | 9.42% |
| 2018 | 2,208 | 9,059.6 | 10,443 | 4.1 | 4.7 | 2.2 | 2.3 | 86.467 | 99.7 | 10.48% |
| 2019 | 2,153 | 8,700.0 | 9,852 | 4.0 | 4.6 | 9.9 | 10.2 | 87.654 | 99.3 | 9.93% |
| 2020 | 2,095 | 8,000.0 | 8,943 | 3.8 | 4.3 | 85.116 | 95.1 | 9.40% | ||
| 2021 | 2,755 | 13,000.1 | 13,907 | 4.7 | 5.0 | 9.9 | 9.9 | 96.527 | 103.3 | 13.47% |
| 2022 | 2,668 | 12,700 | 12,700 | 4.8 | 4.8 | 8.46 | 8.46 | 99.616 | 99.6 | 12.75% |
| Average annual change rate | 7.3% | 10.1% | 7.7% | 2.5% | 0.4% | 5.9% | 4.1% | 4.5% | 2.3% | 5.3% |
| ¹ GDP is the GWP (gross world product) as per the most recent data provided by the World Bank (WB) at the time of the building of the table. Value for 2022 obtained by applying the 2022 International Monetary Fun (IMF) percent change estimate to the WB 2021 GWP value. ² US$ constant (2012=100) computed by applying the US$ GDP deflator. ³ Until 2018, medians are computed on the total billionaire population as listed by Forbes. From 2019 onwards, only the world top 500 billionaires listed by Bloomberg are included. | ||||||||||
Sources: The Bloomberg Billionaires Index, The Forbes Billionaires List, The World Bank-DataBank.