|
Insight : US government debt |

|
|
You are here: areppim > Economy & finance > US government debt
Voodoo economics and the 2008 global crisis
"There's no question about it. Wall Street got drunk. It got drunk and now it's got a hangover. The question is, how long will it sober up and not try to do all these fancy financial instruments?" [G.W.Bush, at Houston,Texas, 18 July 2008]
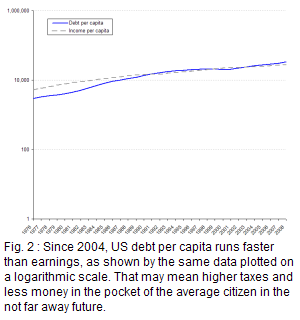
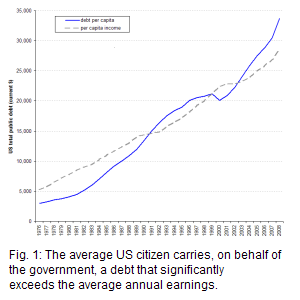
In 2008, the average US citizen owes somebody somewhere more than $33,500 on behalf of the US government. This is 17% more than the average $28,700 money income per person for the year (see enlarged Fig.1 chart). To put it simply, the average person should work 1 year and 2 months to repay the debt incurred by the federal administration. The bad news is that prospects are even worse. The gap between debt and income tends to grow bigger, as suggested by the logarithmic plot of the two variables (see enlarged Fig.2 chart).


Some other industrialised nations have lousy performances too. In 2007, the worst in class were Japan with a $57,000 debt per capita and a total debt amounting to 170% of GDP (gross domestic product), and Italy where the corresponding values attained $32,200 per capita and 104% of GDP. But the sum of the two economies was a mere 43.6% of US GDP, which makes the US case far more worrisome.
The current US government debt causes vertigo. On 9 October 2008 the national debt clock displayed a total debt of $10,266,382,646,544. This exceeds all the money exchanged within the USA during the full year of 2001. It is 2.3 times the estimated 2007 GDP of Japan, the second richest economy worldwide. To better grasp the concept, at the interbank exchange rate of 9 October, it is equivalent to:
- Per second: $ 325,545 or Euro 238,851
- Per minute: $ 19.5 million or Euro 14 million
- Per hour: $ 1,172 billion or Euro 859 million
- Per day: $ 28 billion or Euro 20.6 billion
Debt does not matter - or does it?
Huge US government deficits are not a rare thing. During World War II, national debt exceeded GDP. However, this was an exceptional situation, and it came down to more acceptable levels soon thereafter.
In the 1980's, Ronald Reagan's economic policy, dubbed Reaganomics, or Voodoo economics as George Bush senior called it derogatorily before becoming Reagan's Vice President, is blamed for digging huge deficits. For Reagan, deficits did not matter. The bets were placed on the "supply side economics" and the "trickle down" theories. These approaches claim that decreasing taxes, especially for corporations and wealthy people, is the best way to fuel economic growth. The cash surplus left in the hands of those beneficiaries will "trickle down" to the rest of the economy, inducing growth and employment.
Under Reagan's presidency, debt grew by 189%, at an annual average rate of 8.3%. With debt growth, also grew the numbers of people under the poverty line, homeless, without medical care, without educational assistance, without social grants, without public assistance. Inevitably average people were bound to pay more taxes to finance the deficit – indeed taxes were increased during Reagan's second term.


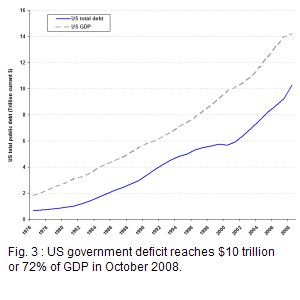
Debt has never been repaid. Even inflation could not redeem it. In fact it never stopped growing, except for a small period towards the end of Clinton's era – in 2000 it decreased by 2% (see enlarged Fig.3 chart). Thereafter, it went for another high ride, growing by 81.3% at an annual average rate of 7.7%, under G.W.Bush's presidency – the second worst debt performance after Reagan's. The trend becomes clear considering that debt represented 58.7% of GDP in 2001, to reach 66.3% in 2007, and an estimated 72.2% in 2008. As a benchmark, the Maastricht convergence criteria (see Glossary) place the ceiling at 60% tops.
Conventional wisdom holds that the big issue with debt is that it carries interest, and one must pay for debt service and amortization. Provided revenues grow faster than debt and interest rates remain under control, the problem is not insurmountable. Otherwise, a debt-powered economy will inevitably hit the wall and reach a point where it cannot service the growing debt anymore. That day the whole system goes berserk. Insolvency, hyperinflation, bankruptcy, unemployment, social unrest, anything can happen as demonstrated just a few years ago in Argentina. In fact, deficit matters a lot.
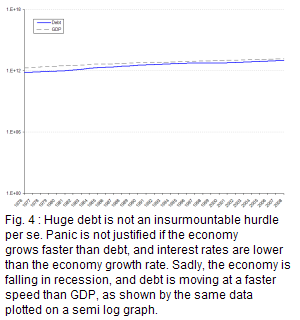
During the Bush years, the wealth of the USA as measured by GDP definitely does not grow fast enough, as shown in the semi-logarithmic graph (see enlarged Fig.4 chart). Debt is in fact growing faster than GDP - by 7.7% against 4.75% for GDP. The difference of 2.95 percentage points means that, other things remaining equal, debt will overtake GDP around 2020, in just 12 years.
The creature of Voodoo economics
At the beginning of the second term, President Bush boasted that he had created a prosperous "ownership society", thanks to his "hands off" deregulation policy, and tax cuts for the richest taxpayers. As evidence, he quoted the rising home values largely driven by the influx of cheap money.
The scheme worked for a while. But it had to be sustained by the ability of the common people to continue making regular payments. This ability in turn depends on steadfast rising home values or a continuing increase of family earnings. Sadly, all but the wealthiest have been badly beaten by falling real wages, rising healthcare and increasing education, fuel and food staples costs. To compound the problem, housing prices began to fall.
The 2008 global financial crisis, triggered by the "subprime" collapse, is by and large the creature of Voodoo economics. Bush's enhancement of the Clinton initiated "hands off" policy allowed rating agencies to mislead millions of investors, financial institutions to create unfathomable masses of toxic securities, banking and stock exchange regulatory authorities to become blind and deaf to all obnoxious practices of banking and non-banking financial institutions, and central bank authorities to care for nothing but strict monetary issues. Bush heavy spending, especially with military expenditures and the waging of two expensive wars, and the anaemic fiscal revenues due to tax cuts for the wealthy, took away all the slack that a balanced budget should provide. More debt is the only option available.
How harmful can the monster be?
High government deficits are sustainable in the long run only if:
- The debt to GDP ratio slows down, meaning that, whatever the level of debt, the economy grows faster;
- The GDP growth rate is stronger than the interest rate, meaning that the economic growth is not licked by rising interest rates.
Otherwise, debt increases today are plainly equivalent to tax increases tomorrow.
In the context of the 2008 financial crisis, with regard to the United States economy:
- Debt is growing faster than GDP by 2.95%.
- Interest rates, however low, are bound to get higher than GDP growth, the latter being threatened by recession, meaning below zero growth.
The potential outcomes are:
- Inflation - treasury lavishly issues government bonds to finance the debt, thus creating money - and correlated asset depreciation.
- Credit crunch and correlated interest rate increases.
- Reduction of investment and consumption in all interest-sensitive economic sectors.
- Loss of business and consumer confidence in the ability of the government to control the budget, inducing a slowdown of capital investment and of real economy activity.
- More unemployment and less tax revenues.
- Exchange rate movements potentially damageable to the trade balance and to the confidence of foreign investors.
- Freezing of financial markets, concerned with inflation and with the decline of borrowers' assets value.
- Wave of bankruptcies further harming real economic activity.
- Widespread social pain caused by rising taxes, lowering social benefits, higher unemployment, lower wages, more uncertainty and dark anticipations.
Bush's debt may well be the first stage of a runaway systemic debt. Contrary to his words quoted in the opening, the hangover is not only affecting Wall Street, but also the entire world. Hopefully it will stop short of an intoxication coma.
Download
- Sources: (i) Debt : US Treasury, Bureau of the Public Debt http://www.treasurydirect.gov/NP/NPGateway-->; (ii) GDP : BEA Bureau of Economic Analysis; (iii) Per capita income : US Census Bureau (iv) various comparative data : CIA, The World Factbook.
- Values are in current dollars.
- Debt corresponds to the "total public debt outstanding", defined by the Bureau of Public Debt as all federal debt held by individuals, corporations, state or local governments, foreign governments, and other entities outside the United States and include, but are not limited to, Treasury Bills, Notes, Bonds, TIPS, United States Savings Bonds, and State and Local Government Series securities.
- Income per capita is defined by the US Census Bureau as the sum of money receipts from earnings, unemployment compensation, social security, public assistance, veteran's benefits, pension income, educational assistance, alimony, and other divided by the current US population.
- 2008 values for GDP, debt and income per capita were computed by areppim as an annualised simple average based on the source reports covering the first and second quarters of the year.]


 Go toTop
 Home
Home