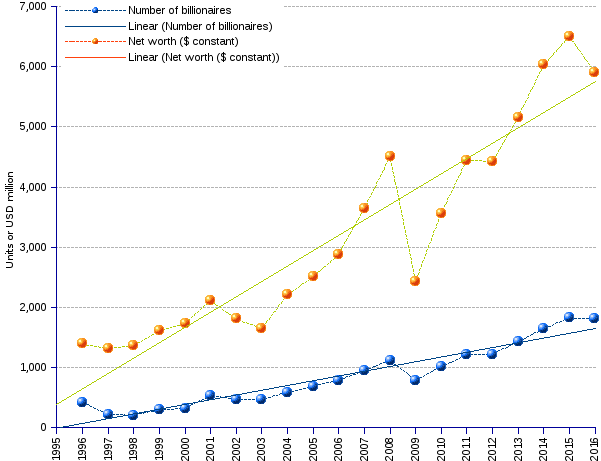
Unfolding crisis, unemployment, over-indebtedness, poverty, precariousness — that is today's cocktail for the commoner. For billionaires, courtesy of their tooth fairy, the road is much smoother and unencumbered. The number of billionaires grew from 423 in 1996, to 1,810 in 2016 (7.5% annual average growth, or a 9-year doubling time). Their net worth swelled in parallel from $US 1,393 billion (constant, 2009=100) to $US 5,906 billion (7.5% annual average growth).
Funny enough, billionaires replicate in-house what they callously imposed on the world at large: the rising polarization of the wealth distribution. A handful of arch-wealthy grab the lion's share, while the crowd of lesser billionaires are stuck at the 1 billion threshold. Currently, the top 15% of billionaires own 50% of the total billionaires' net worth, while the lowest 15% own only — if the adverb makes sense in the context of giga-dollars — 4.5% or 11 times less.
The world did not, as yet, regain health from the financial and economic downturn that knocked it out in 2008. The living conditions of the majority of the people have been severely hampered: 700 million people or 12.7% of the world population survived on less than $1.90 per day in 2012; 122.3 million people, or 24.4% of the population in the rich European Union (28 members) were at risk of poverty or social exclusion in 2014. Across the planet millions of people are falling below the poverty line (generally placed at 60 percent of the average national income) victimized by the evanescing labor wages, the rising unemployment, the evaporation of jobs, and the increasingly delinquent state.
Billionaires are not immune to crises but, contrary to the average man in the street, they recover well and fast. While the world endures the pain of a sluggish economic engine, billionaires aptly redirected to their balance sheets a growing chunk of the assets produced by the common people, thus achieving the expansion of their net worth at a much faster rate than the world output. They are liable to consider it as a justified reward for their talents and energy. The hardheaded will retort that the whole affair boils down to a clear case of relative strengths — the stronger wins and the winner takes all.
World Billionaires | |||||
Year(click on the link to get the list of billionaires for the year) |
Number |
Net Worth |
Average ² |
Median ² |
|
| USD billion current | USD billion constant (2009=100) ¹ |
||||
| 1996 | 423 | 1,050 | 1,393 | 3.3 | 2.5 |
| 1997 | 224 | 1,010 | 1,317 | 5.9 | 3.8 |
| 1998 | 209 | 1,069 | 1,370 | 6.6 | 4.2 |
| 1999 | 298 | 1,271 | 1,612 | 5.4 | 3.6 |
| 2000 | 322 | 1,386 | 1,731 | 5.4 | 3.6 |
| 2001 | 538 | 1,729 | 2,111 | 3.9 | 2.3 |
| 2002 | 472 | 1,516 | 1,809 | 3.8 | 2.1 |
| 2003 | 476 | 1,403 | 1,650 | 3.5 | 2.0 |
| 2004 | 587 | 1,917 | 2,210 | 3.8 | 2.2 |
| 2005 | 691 | 2,236 | 2,509 | 3.6 | 2.2 |
| 2006 | 793 | 2,645 | 2,876 | 3.6 | 2.2 |
| 2007 | 946 | 3,452 | 3,641 | 3.8 | 2.2 |
| 2008 | 1,125 | 4,381 | 4,501 | 4.0 | 2.3 |
| 2009 | 793 | 2,415 | 2,433 | 3.1 | 1.8 |
| 2010 | 1,011 | 3,568 | 3,568 | 2.0 | 3.5 |
| 2011 | 1,210 | 4,496 | 4,442 | 2.0 | 3.7 |
| 2012 | 1,226 | 4,575 | 4,428 | 3.6 | 2.0 |
| 2013 | 1,426 | 5,432 | 5,163 | 3.6 | 2.0 |
| 2014 | 1,645 | 6,446 | 6,029 | 3.7 | 2.1 |
| 2015 | 1,826 | 7,063 | 6,499 | 3.6 | 1.9 |
| 2016 | 1,810 | 6,483 | 5,906 | 3.3 | 1.9 |
| Average annual change rate | 7.5% | 9.5% | 7.5% | -0.05% | -1.5% |
| Average annual change rate (1996-2008) | 8.5% | 12.6% | 10.3% | 1.6% | -0.9% |
| Average annual change rate (2009-2015) | 14.9% | 19.6% | 17.8% | 2.5% | 1.1% |
| Average annual change rate (2015-2016) | -0.9% | -8.2% | -9.1% | -8.3% | -3.3% |
| ¹ Adjusted by applying the previous year $US GDP deflator index. ² Average and median values relate to Net Worth in constant $US (2009=100). | |||||
Sources: Forbes List of billionaires.