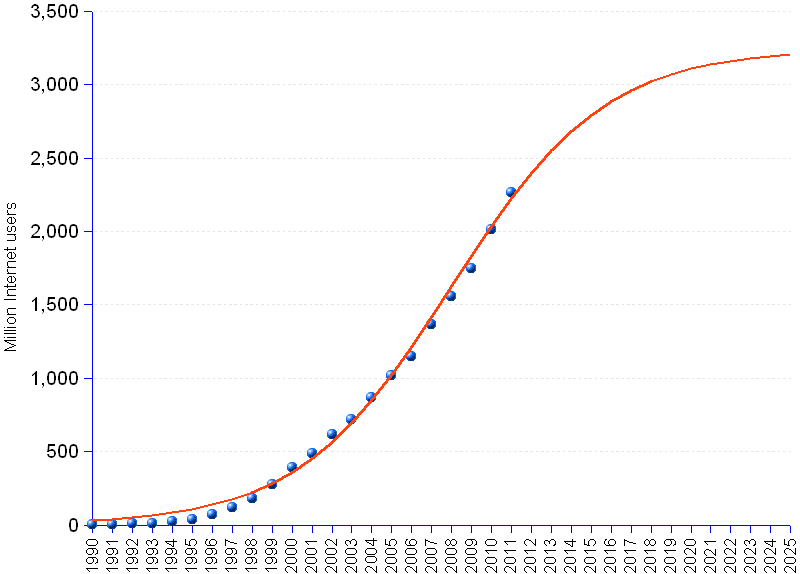
The number of world Internet users reached 2.3 billion by end 2011 (blue dots in the chart), and is likely to continue growing for some more years, up to an estimated saturation point of 3.2 billion users (red line in the chart) to happen around 2026. Data from International Telecommunications Union (ITU) covering the period 1990-2011 reveals that growth has been exponential until the inflection point in 2008, when volume reached 1.6 billion, after which it started to slowly decelerate.
The current forecast (compare with 2008 and 2010 forecasts) suggests that Internet users will approach the plateau of 3.2 billion by 2026 and reach 90% of total potential market as soon as 2016. Such a scenario makes sense considering the prevailing Internet habits nowadays — 3.2 billion users is equivalent to roughly one Internet subscription per home, which is a sensible conjecture.
However, one should not exclude the possibility that mobile Internet services, in other words access to Internet services through cellular phones and other mobile devices, could cause the surge of the number of Internet users, causing them to exceed the 3.2 billion saturation point, in the same way mobile phone caused the explosion of the number of telephone subscribers.
Quoted hereinafter are other pertinent findings highlighted in June 2012 ITU's data release :
World Internet Users | ||
Year | Number | |
| Actual | Forecast ¹ | |
| 1990 | 2.64 | 29.7 |
| 1991 | 4.4 | 38.4 |
| 1992 | 7 | 49.7 |
| 1993 | 10 | 64.1 |
| 1994 | 21 | 82.7 |
| 1995 | 40 | 106.5 |
| 1996 | 74 | 136.8 |
| 1997 | 117 | 175.3 |
| 1998 | 183 | 223.8 |
| 1999 | 275 | 284.5 |
| 2000 | 390 | 359.7 |
| 2001 | 489 | 451.7 |
| 2002 | 616 | 562.7 |
| 2003 | 721 | 694.2 |
| 2004 | 867 | 846.7 |
| 2005 | 1,022 | 1,019.3 |
| 2006 | 1,150 | 1,209.4 |
| 2007 | 1,364 | 1,412.4 |
| 2008 | 1,560 | 1,622.3 |
| 2009 | 1,746 | 1,832.3 |
| 2010 | 2,013 | 2,035.3 |
| 2011 | 2,265 | 2,225.4 |
| 2012 | 2,398.0 | |
| 2013 | 2,550.5 | |
| 2014 | 2,682.0 | |
| 2015 | 2,793.0 | |
| 2016 | 2,885.0 | |
| 2017 | 2,960.2 | |
| 2018 | 3,020.9 | |
| 2019 | 3,069.4 | |
| 2020 | 3,107.9 | |
| 2021 | 3,138.2 | |
| 2022 | 3,162.0 | |
| 2023 | 3,180.5 | |
| 2024 | 3,195.0 | |
| 2025 | 3,206.3 | |
| ¹ Logistic growth function | ||
Source: ITU International Telecommunications Union