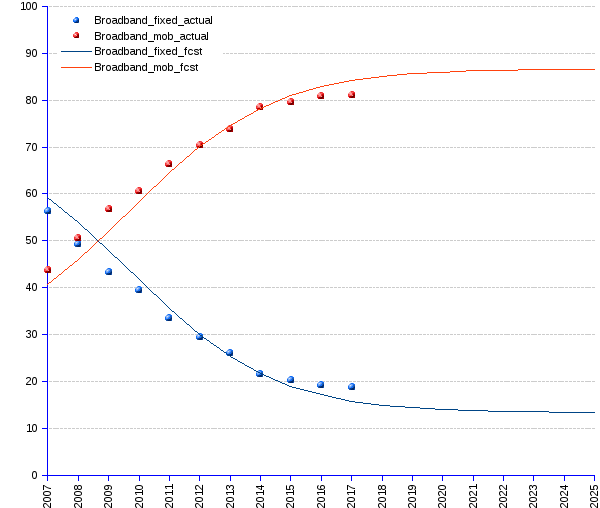
![]() Broadband subscriptions : actuals and forecast | market shares |
Broadband subscriptions : actuals and forecast | market shares |

Mobile technology and services continue to be the main driver of the information society. By the end of 2017, world subscriptions to Internet broadband services are expected to reach 5.2 billion, of which 979 million (19%) for fixed wired, and 4.2 billion (81%) for mobile broadband, according to ITU (International Telecommunications Union).
It is likely that mobile broadband services will soon become as ubiquitous as mobile cellular telephony. According to areppim's forecasts, by 2025 there will be 5 billion mobile broadband subscriptions, following the trail of mobile cellular devices subscriptions.
Mobile broadband networks are allowing more people to benefit from a larger array of Internet applications and services. While both fixed and mobile broadband speeds continue to increase, the price of services is falling and ICTs (Information communications and technology) are becoming more affordable, thanks to steadily falling prices : in the space of four years, fixed broadband prices have dropped by more than 80%.
The fixed broadband divide between developed and developing regions remains deep. According to the latest ITU estimates, by end 2017 fixed broadband penetration will reach almost 13% globally, 31% in developed countries and around 10% in developing countries. The reason for the gap is the still unaffordable price of the fixed broadband services for most people in developing countries.
In developed countries, mobile broadband is often a complement to, rather than a substitute for fixed broadband access. The picture is altogether a distinct one in the developing world, where 53% of the population live in rural areas. Given the very limited fixed networks available there, it is simply impossible to connect all these people to high-speed Internet. Wireless Internet access — either through the mobile broadband network or via fixed wireless or satellite — is often the only alternative to fixed Internet access. The continuous increase in wireless broadband deployment and services, coupled with falling prices, are expected to improve Internet access in households in developing regions over the next few years.
Internet Broadband Subscriptions | ||||
Year |
Actual broadband subscribers |
Forecast ¹ |
||
| Fixed (wired) | Mobile; | Fixed | Mobile | |
| 2005 | 220 | 202.9 | ||
| 2006 | 284 | 263.6 | ||
| 2007 | 346 | 268 | 332.6 | 228.3 |
| 2008 | 411 | 422 | 406.4 | 347.0 |
| 2009 | 468 | 615 | 480.1 | 521.1 |
| 2010 | 526 | 807 | 549.1 | 768.9 |
| 2011 | 598 | 1,184 | 609.8 | 1,107.1 |
| 2012 | 649 | 1,550 | 660.4 | 1,543.2 |
| 2013 | 692 | 1,959 | 700.7 | 2,066.1 |
| 2014 | 731 | 2,660 | 731.7 | 2,641.0 |
| 2015 | 842 | 3,297 | 754.8 | 3,215.9 |
| 2016 | 917 | 3,864 | 771.7 | 3,738.8 |
| 2017 | 979 | 4,220 | 783.8 | 4,174.9 |
| 2018 | 792.5 | 4,513.1 | ||
| 2019 | 798.6 | 4,760.9 | ||
| 2020 | 802.9 | 4,935.0 | ||
| 2021 | 805.9 | 5,053.7 | ||
| 2022 | 807.9 | 5,133.0 | ||
| 2023 | 809.4 | 5,185.3 | ||
| 2024 | 810.4 | 5,219.5 | ||
| 2025 | 811.1 | 5,241.7 | ||
| Annual average growth rate | 13.25% | 31.74% | 9.10% | 28.22% |
| ¹ Forecast by the logistic function method. | ||||


Although mobile cellular phone penetration is slowing down, reaching 103% of the world population and 94% of saturation by end 2017, broadband services provided by mobile devices continue to grow on average by around 32% annually between 2007 and 2017. Fixed broadband uptake is also growing, but at a slower pace, around 13% annually since 2005.
As is the case of mobile devices, mobile broadband is mercilessly dethroning fixed broadband. In 2008 the two technologies shared the broadband market with roughly equal shares. However, from 2008 to 2017, while the fixed broadband market share shrunk at the annual average of -13%, the mobile's grew at 6%, thus creating a rapidly enlarging gap between the two. In areppim's forecast, by 2025 mobile broadband will own 87% of the market, leaving 13% for the fixed broadband.
Broadband : fixed and mobile | ||||
Date |
Actual market shares |
Forecasts |
||
| Fixed | Mobile | Fixed | Mobile | |
| 2005 | 100 | 100 | ||
| 2006 | 100 | 100 | ||
| 2007 | 56.4 | 43.6 | 59.3 | 40.7 |
| 2008 | 49.3 | 50.7 | 53.9 | 46.1 |
| 2009 | 43.2 | 56.8 | 48.0 | 52.0 |
| 2010 | 39.5 | 60.5 | 41.7 | 58.3 |
| 2011 | 33.6 | 66.4 | 35.5 | 64.5 |
| 2012 | 29.5 | 70.5 | 30.0 | 70.0 |
| 2013 | 26.1 | 73.9 | 25.3 | 74.7 |
| 2014 | 21.5 | 78.5 | 21.7 | 78.3 |
| 2015 | 20.3 | 79.7 | 19.0 | 81.0 |
| 2016 | 19.2 | 80.8 | 17.1 | 82.9 |
| 2017 | 18.8 | 81.2 | 15.8 | 84.2 |
| 2018 | 14.9 | 85.1 | ||
| 2019 | 14.4 | 85.6 | ||
| 2020 | 14.0 | 86.0 | ||
| 2021 | 13.8 | 86.2 | ||
| 2022 | 13.6 | 86.4 | ||
| 2023 | 13.5 | 86.5 | ||
| 2024 | 13.4 | 86.6 | ||
| 2025 | 13.4 | 86.6 | ||
| Annual average change rate | -13.00% | 6.4% | -9.6% | 4.3% |
| ¹ Technology substitution forecast method | ||||
Source: ITU International Telecommunications Union