areppim: information, pure and simple
Many growth curves take a shape that resembles an exponential curve, although one cannot tell for sure that they are genuine exponential functions without deeper analysis. Fortunately, there is an easy way to find out : we can mathematically transform exponential into linear growth, by taking the logarithms of the data points instead of the data points themselves. If a variable grows exponentially, its logarithm grows linearly. Conversely, when data points do not align exactly to the line of fit, the function is not exponential.
Straight lines are easy to handle, whereas the mathematics of exponential functions is more convoluted. Since the logarithms of data produce a straight line, we can fit a least-squares regression line to the logarithms and analyze the data in a variety of ways that would prove very cumbersome otherwise :
(data : table of mobile and desktop Web market shares.)


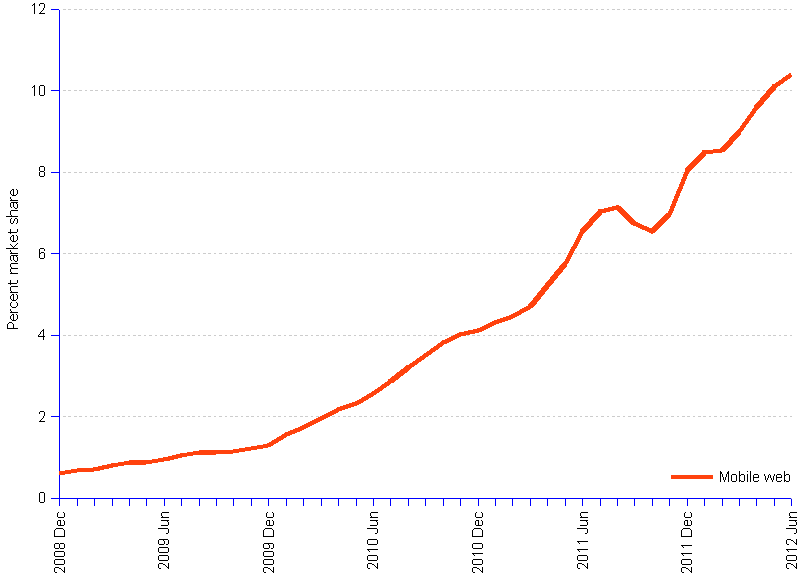
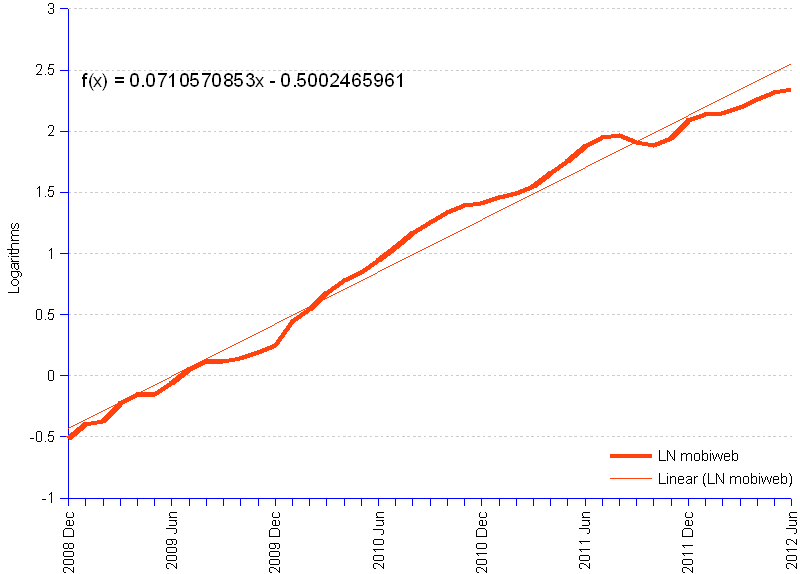
The first chart shows the actual Web mobile market share growth curve. At first sight, the growth seems to be exponential — with some bumps. The second chart displays the logarithm transformation of the initial data, producing a regression line of which the solution is given. Data points deviate from the straight line — it is not an exponential function. By plotting the residuals (actual - line of fit values), we can explore what happened that might explain the distancing from the straight line ("lurking" variables).


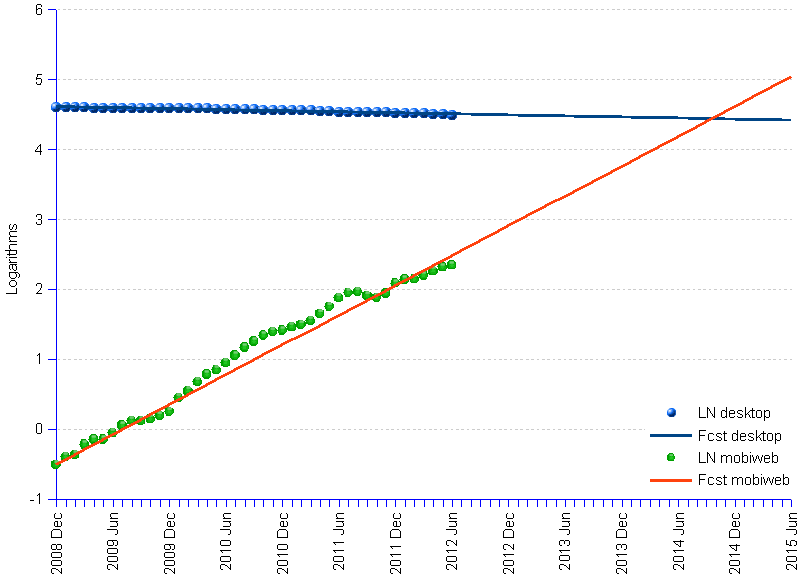
By plotting the logarithm transformation of both the mobile Web and desktop Web, and extending the regression line into the future, we see that lines cross in 2014, suggesting that mobile (red) will substitute to desktop (blue) around that point in time.
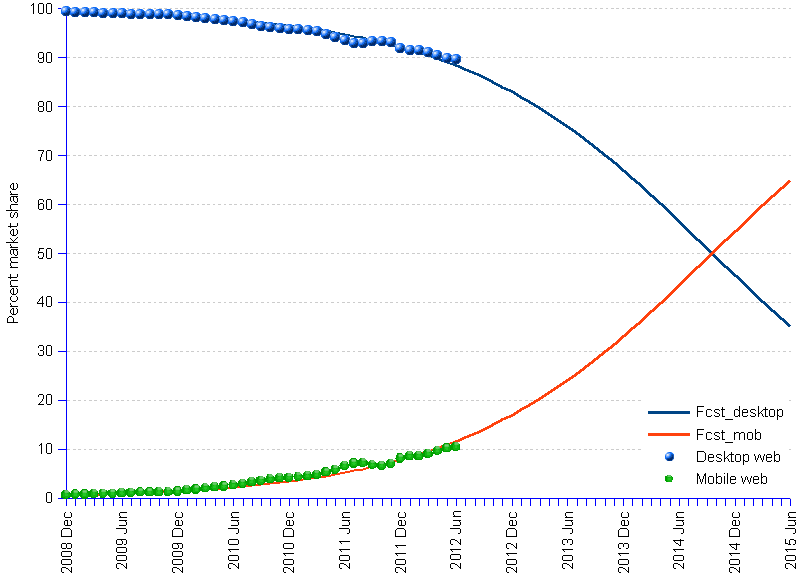
To display the forecasts as percent of market share, which was the measurement unit of the original data, one needs to transform the logarithms back to the percent data (x = eln), while constraining the values to the ceiling of 1 (since the total market share cannot exceed 100%).