areppim: information, pure and simple

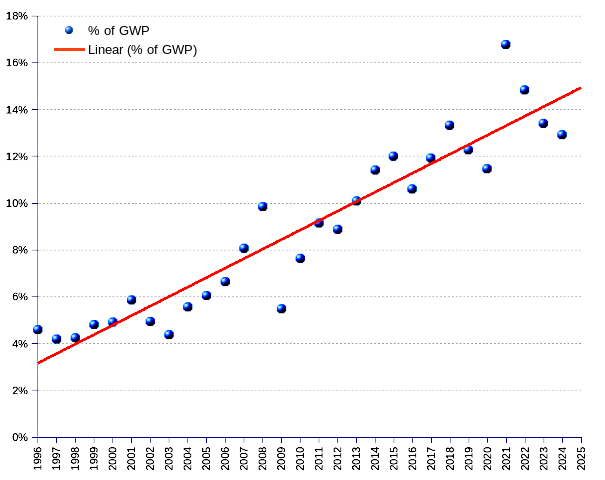
According to the Forbes 2025 list of billionairesa>, the total net worth of the 3,028 world billionaires amounts to 16.1 $trillion. That represents a sizable 14.17 % cut of the the value of the global output of the whole world in the course of a full year, call it the gross world product (GWP).
The billionaires’ wealth grew much faster than the wealth produced by the world. In constant $US, from 1996 to 2025, the billionaires’ wealth grew at the annual average rate of 7.5 % (doubling time 9.58 years), against 2.3 % (doubling time 30.48 years) for GWP. In other words, every single year the billionaires seized a larger slice of the cake, leaving a shrinking portion for other people.
This shouldn’t be an issue, provided the remaining portion allowed people to meet their basic needs, and be granted equitable opportunities to improve their lives. Regretfully, the dices are loaded. While in many countries social subsidies are being discontinued, particularly in such vital areas as healthcare, education, food assistance, housing, and employment, more and more state money keeps flowing from taxpayers to the richest few.
It is a kind of zero-sum game. The ones’ gains are balanced by the others’ losses. On one side, alleged economic pressures drive governments to impose austerity measures on their constituencies, in order to overcome purported budget constraints. On the other side, state funding is aplenty to finance a multitude of costly, fruitless and often harmful private initiatives. Ironically, such state-supported private initiatives come regularly from the same “liberal” folks that invariably vociferate against public spending with social relief.
The USA is the flag bearer in this regard. Funding for a variety of assistance programs ran out in 2024, leaving Americans with fewer resources to help cope with rising prices and stagnating incomes. Food benefits, housing support, funding for child care centers, and other important programs that provide key services to people with low incomes and under-served communities have already been, or are in the process of being terminated or drastically pruned.
Meanwhile, fossil fuel subsidies reached a record high of $1.53 trillion in 2022, and public funds shoring up the production and consumption of oil, coal and gas more than doubled between 2021 and 2022, and more than tripled from their 2015 levels. The U.S. military industry has significantly benefited from the war in Ukraine, with contracts of billions of dollars funneled to defense manufacturers to produce and supply arms and ammunition to Ukraine, and to replenish the emptied arsenals. As general Butler used to say, War Is A Racket, and a most profitable one for business interests.
Elon Musk, the world number one billionaire, with an estimated wealth of 333 $Billion, is commonly identified as a « libertarian », that is, someone who demands full individual liberty, unrestrained self-government, and zero encroaching of the state in one’s private affairs. This is the facade. The flip side exposes a complicated entanglement with the state. Musk and his companies, particularly Tesla and SpaceX, have benefited from various subsidies and incentives from the U.S. government. Some of the key forms of support include : tax credits for electric vehicles (likely hundreds of millions of dollars during the time they were available) ; grants and loans from the Department of Energy ; contracts from NASA and the U.S. government for various projects (in the range of $10 billion or more) ; various federal and state incentives aimed at promoting renewable energy, including tax credits for solar energy installations (in the hundreds of millions of dollars) ; federal, state, and local funding and incentives aimed at promoting EV adoption and infrastructure development (in the range of hundreds of millions of dollars).
Of course, the problem is not Musk and his ilks. Who cares about their earnings, who cares about their spending ? The problem is with the left behinds. The problem is that, after the billionaires checked out, there is no tax-payer money left for the have-nots, for the social rejects whose rehabilitation, in many instances their sheer survival, is jeopardized. Over feeding the wealthy, and starving the poor doesn’t make our world a beautiful place to live in.

 "
"
| Year | World Billionaires | GDP (gross world product) ¹ | Billionaire Net Worth as percent of GDP | |||||||
|---|---|---|---|---|---|---|---|---|---|---|
| Number | Net Worth | Average | Median ² | (trillion US$ current) | (trillion US$ constant, 2015 =100) | |||||
| (billion US$ current) | (billion US$ constant, 2017=100) ³ | (billion US$ current) | (billion US$ constant, 2017=100) ³ | (billion US$ current) | (billion US$ constant, 2017=100) ³ | |||||
| 1996 | 423 | 1,049.5 | 1,959 | 2.5 | 4.6 | 1.9 | 3.5 | 31.867 | 58.545 | 3.35% |
| 1997 | 224 | 1,010.0 | 1,854 | 4.5 | 8.3 | 2.9 | 5.2 | 31.761 | 57.361 | 3.23% |
| 1998 | 209 | 1,069.1 | 1,940 | 5.1 | 9.3 | 3.3 | 5.9 | 31.703 | 56.620 | 3.43% |
| 1999 | 298 | 1,270.9 | 2,274 | 4.3 | 7.6 | 2.9 | 5.0 | 32.747 | 57.669 | 3.94% |
| 2000 | 322 | 1,386.1 | 2,426 | 4.3 | 7.5 | 2.9 | 5.0 | 33.856 | 58.301 | 4.16% |
| 2001 | 538 | 1,728.6 | 2,958 | 3.2 | 5.5 | 1.9 | 3.2 | 33.646 | 56.663 | 5.22% |
| 2002 | 472 | 1,515.5 | 2,554 | 3.2 | 5.4 | 1.8 | 3.0 | 34.940 | 57.943 | 4.41% |
| 2003 | 476 | 1,403.3 | 2,319 | 2.9 | 4.9 | 1.7 | 2.8 | 39.182 | 63.719 | 3.64% |
| 2004 | 587 | 1,917.2 | 3,085 | 3.3 | 5.3 | 1.9 | 3.0 | 44.151 | 69.920 | 4.41% |
| 2005 | 691 | 2,236.2 | 3,489 | 3.2 | 5.0 | 2.0 | 3.1 | 47.812 | 73.415 | 4.75% |
| 2006 | 793 | 2,645.5 | 4,005 | 3.3 | 5.0 | 2.0 | 3.0 | 51.815 | 77.183 | 5.19% |
| 2007 | 946 | 3,452.0 | 5,088 | 3.6 | 5.4 | 2.1 | 3.0 | 58.389 | 84.681 | 6.01% |
| 2008 | 1,125 | 4,381.0 | 6,335 | 3.9 | 5.6 | 2.2 | 3.1 | 64.152 | 91.280 | 6.94% |
| 2009 | 793 | 2,414.7 | 3,470 | 3.0 | 4.4 | 1.8 | 2.5 | 60.814 | 86.000 | 4.03% |
| 2010 | 1,011 | 3,567.8 | 5,066 | 3.5 | 5.0 | 3.5 | 4.9 | 66.610 | 93.064 | 5.44% |
| 2011 | 1,210 | 4,496.3 | 6,255 | 3.7 | 5.2 | 3.7 | 5.1 | 74.081 | 101.411 | 6.17% |
| 2012 | 1,226 | 4,574.5 | 6,247 | 3.7 | 5.1 | 2.1 | 2.8 | 75.706 | 101.740 | 6.14% |
| 2013 | 1,426 | 5,431.8 | 7,294 | 3.8 | 5.1 | 2.1 | 2.8 | 77.873 | 102.902 | 7.09% |
| 2014 | 1,645 | 6,446.5 | 8,508 | 3.9 | 5.2 | 2.2 | 2.9 | 80.020 | 103.929 | 8.19% |
| 2015 | 1,826 | 7,063.2 | 9,237 | 3.9 | 5.1 | 2.1 | 2.7 | 75.472 | 97.121 | 9.51% |
| 2016 | 1,810 | 6,482.6 | 8,397 | 3.6 | 4.6 | 2.1 | 2.6 | 76.703 | 97.774 | 8.59% |
| 2017 | 2,043 | 7,668.0 | 9,758 | 3.8 | 4.8 | 2.1 | 2.6 | 81.712 | 102.328 | 9.54% |
| 2018 | 2,208 | 9,059.6 | 11,271 | 4.1 | 5.1 | 2.2 | 2.7 | 86.885 | 106.369 | 10.60% |
| 2019 | 2,153 | 8,700.0 | 10,645 | 4.0 | 4.9 | 9.9 | 11.9 | 88.150 | 106.136 | 10.03% |
| 2020 | 2,095 | 8,000.0 | 9,661 | 3.8 | 4.6 | 0.0 | 85.763 | 101.917 | 9.48% | |
| 2021 | 2,755 | 13,000.1 | 15,011 | 4.7 | 5.4 | 9.9 | 11.2 | 97.848 | 111.181 | 13.50% |
| 2022 | 2,668 | 12,700.0 | 13,700 | 4.8 | 5.1 | 0.0 | 101.771 | 108.031 | 12.68% | |
| 2023 | 2,640 | 12,200.0 | 12,698 | 4.6 | 4.8 | 8.46 | 8.7 | 106.172 | 108.739 | 11.68% |
| 2024 | 2,781 | 14,200.0 | 14,430 | 5.1 | 5.2 | 11.00 | 11.0 | 110.070 | 110.070 | 13.11% |
| 2025 | 3,028 | 16,100.0 | 16,100 | 5.3 | 5.3 | 10.90 | 10.7 | 115.490 | 113.648 | 14.17% |
| Average annual change rate | 7.0% | 9.9% | 7.5% | 2.7% | 0.5% | 6.2% | 3.9% | 4.5% | 2.3% | 5.1% |
| ¹ GDP is the GWP (gross world product) as per the most recent data provided by the World Bank (WB) at the time of the building of the table. Values for 2024 and 2025 from statisticstime.com. ² Until 2018, medians are computed on the total billionaire population as listed by Forbes. From 2019 onwards, only the world top 500 billionaires listed by Bloomberg are included. ³ US$ constant (2017=100) computed by applying the US$ GDP deflator from the US Bureau of Economic Analysis. The GDP deflator estimate for 2025 comes from tradingeconiomics.com | ||||||||||
Sources: The Bloomberg Billionaires Index, The Forbes Billionaires List, The World Bank-DataBank.