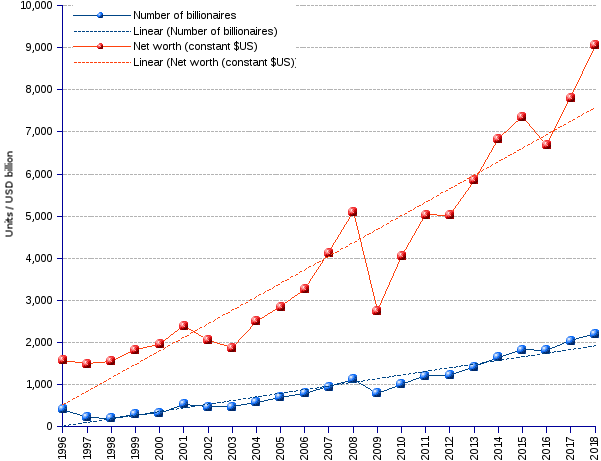
From constant US$ trillion 1.6 in 1996 to 9.1 in 2018, the share of wealth grabbed by the super-rich provides evidence of the agonizing thirst and hunger that excruciate the contemporary Tantalus that are our fellow billionaires. With a critical twist, however: contrary to the mythical creature, the modern Tantalus can reach the fruits hanging above the head, and can drink the water that flows under the chin. Could it be that, because of old age or something, Zeus became lenient and easy going for the culprits of crimes like those of the classical mythological figure? One recalls that the abominable Tantalus sacrificed his own son, cut him into pieces, cooked him and served him up in a banquet for the gods. The latter considered the treat somewhat too gruesome. The infuriated Zeus issued a verdict that minted the word tantalize.
Strangely enough, today's billionaires behave just like the mythological creature. They sacrifice their human fellows at the altar of shareholder value. They carve workers' schedules into pieces of precarious jobs, part-time assignments and moonlighting. They stew them in the juice of subsistence wages, seasoned with marketing-induced wants. They grind them through the relentless workings of indebtedness. And they lusciously chew the savory interests and capital gains for evermore. And the gods, what the heck do they do? Well, they just look at the show with torpidness, and they do not budge the little finger of their supposed invisible hand. Unlike Greek gods, modern ones are desinclined to mess with human affairs.
The 2008 global financial debacle prompted many rationalizations about the end of speculative finance, unruly capitalism, privatization of gains and nationalization of losses, and unbridled inequality. The old wild financial capitalism seemed doomed. Ten years later, it is still alive and well — if anything, it never fared that well! It allowed for the number of billionaires to grow from 423 in 1996, to 2,208 in 2018 (7.8% annual average growth, or a 9-year doubling time). Their net worth swelled in parallel from $US 1,580.3 billion (constant, 2009=100) to $US 9,059.6 billion (8.3% annual average growth). As of now, short of an unexpected shift, nothing seems to threaten this irresistible ascent. Until Zeus awakes and decides that enough is enough.
World Billionaires | |||||
Year(click on the link to get the list of billionaires for the year) |
Number |
Net Worth |
Average ² |
Median ² |
|
| USD billion current | USD billion constant (2009=100) ¹ |
||||
| 1996 | 423 | 1,049.5 | 1,580.3 | 3.7 | 2.9 |
| 1997 | 224 | 1,010.0 | 1,493.6 | 6.7 | 4.3 |
| 1998 | 209 | 1,069.1 | 1,554.4 | 7.4 | 4.8 |
| 1999 | 298 | 1,270.9 | 1,827.9 | 6.1 | 4.1 |
| 2000 | 322 | 1,386.1 | 1,963.6 | 6.1 | 4.1 |
| 2001 | 538 | 1,728.6 | 2,394.3 | 4.5 | 2.6 |
| 2002 | 472 | 1,515.5 | 2,052.3 | 4.3 | 2.4 |
| 2003 | 476 | 1,403.3 | 1,871.7 | 3.9 | 2.3 |
| 2004 | 587 | 1,917.2 | 2,507.1 | 4.3 | 2.5 |
| 2005 | 691 | 2,236.2 | 2,846.0 | 4.1 | 2.5 |
| 2006 | 793 | 2,645.5 | 3,261.9 | 4.1 | 2.5 |
| 2007 | 946 | 3,452.0 | 4,129.5 | 4.4 | 2.5 |
| 2008 | 1,125 | 4,381.0 | 5,105.0 | 4.5 | 2.6 |
| 2009 | 793 | 2,414.7 | 2,759.6 | 3.5 | 2.1 |
| 2010 | 1,011 | 3,567.8 | 4,046.7 | 2.3 | 4.0 |
| 2011 | 1,210 | 4,496.3 | 5,038.3 | 2.2 | 4.2 |
| 2012 | 1,226 | 4,574.5 | 5,022.2 | 4.1 | 2.3 |
| 2013 | 1,426 | 5,431.8 | 5,855.6 | 4.1 | 2.3 |
| 2014 | 1,645 | 6,446.5 | 6,839.0 | 4.2 | 2.3 |
| 2015 | 1,826 | 7,063.2 | 7,361.1 | 4.0 | 2.2 |
| 2016 | 1,810 | 6,482.6 | 6,683.5 | 3.7 | 2.1 |
| 2017 | 2,043 | 7,668.0 | 7,806.1 | 3.8 | 2.1 |
| 2018 | 2,208 | 9,059.6 | 9,059.6 | 4.1 | 2.2 |
| Average annual change rate | 7.80% | 10.29% | 8.26% | 0.43% | -1.19% |
| Average annual change rate (1996-2008) | 8.49% | 12.65% | 10.26% | 1.63% | -0.91% |
| Average annual change rate (2009-2018) | 12.05% | 15.83% | 14.12% | 1.85% | 0.75% |
| ¹ Adjusted by applying the previous year $US GDP deflator index. ² Average and median values relate to Net Worth in constant $US (2009=100). | |||||
Sources: Forbes List of billionaires.