 Check also desktop and mobile Web market share trends by region :
 Check also desktop and mobile Web market share trends by region :
world pie chart | world time series | Africa | Asia | Europe | North America | Oceania | South America | Switzerland.

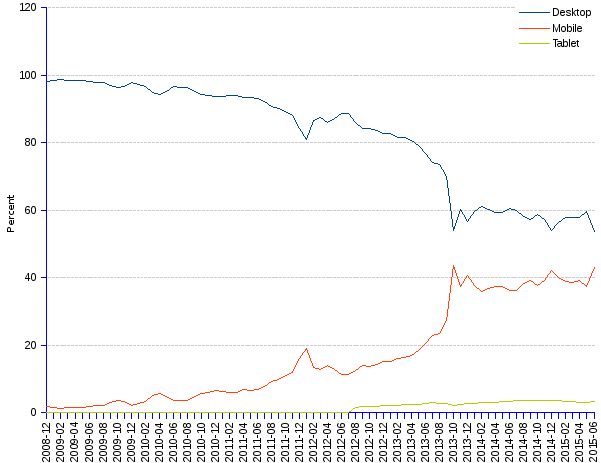
Desktop web takes 54% of the African market, while mobile web has a share of 43%, and tablets a share of 3%. Mobile Web however has been growing at a monthly average rate of 1%, while desktop market share shrinks gradually at a approximately the same monthly average rate. Africa is, behind Asia, the region where mobile web's share is the highest.
| Date | Desktop | Mobile | Tablet |
| 2008-12 | 98.18 | 1.82 | 0 |
| 2009-01 | 98.46 | 1.54 | 0 |
| 2009-02 | 98.6 | 1.4 | 0 |
| 2009-03 | 98.44 | 1.56 | 0 |
| 2009-04 | 98.3 | 1.7 | 0 |
| 2009-05 | 98.39 | 1.61 | 0 |
| 2009-06 | 98.22 | 1.78 | 0 |
| 2009-07 | 97.94 | 2.06 | 0 |
| 2009-08 | 97.76 | 2.24 | 0 |
| 2009-09 | 96.79 | 3.21 | 0 |
| 2009-10 | 96.21 | 3.79 | 0 |
| 2009-11 | 96.76 | 3.24 | 0 |
| 2009-12 | 97.79 | 2.21 | 0 |
| 2010-01 | 97.3 | 2.7 | 0 |
| 2010-02 | 96.65 | 3.35 | 0 |
| 2010-03 | 94.97 | 5.03 | 0 |
| 2010-04 | 94.24 | 5.76 | 0 |
| 2010-05 | 95.1 | 4.9 | 0 |
| 2010-06 | 96.47 | 3.53 | 0 |
| 2010-07 | 96.45 | 3.55 | 0 |
| 2010-08 | 96.23 | 3.77 | 0 |
| 2010-09 | 95.23 | 4.77 | 0 |
| 2010-10 | 94.19 | 5.81 | 0 |
| 2010-11 | 94.09 | 5.91 | 0 |
| 2010-12 | 93.51 | 6.49 | 0 |
| 2011-01 | 93.67 | 6.33 | 0 |
| 2011-02 | 93.86 | 6.14 | 0 |
| 2011-03 | 93.99 | 6.01 | 0 |
| 2011-04 | 93.23 | 6.77 | 0 |
| 2011-05 | 93.34 | 6.66 | 0 |
| 2011-06 | 92.98 | 7.02 | 0 |
| 2011-07 | 92.12 | 7.88 | 0 |
| 2011-08 | 90.7 | 9.3 | 0 |
| 2011-09 | 90.24 | 9.76 | 0 |
| 2011-10 | 89.08 | 10.92 | 0 |
| 2011-11 | 88.04 | 11.96 | 0 |
| 2011-12 | 84.04 | 15.96 | 0 |
| 2012-01 | 80.83 | 19.17 | 0 |
| 2012-02 | 86.44 | 13.56 | 0 |
| 2012-03 | 87.29 | 12.71 | 0 |
| 2012-04 | 86.02 | 13.98 | 0 |
| 2012-05 | 87.11 | 12.89 | 0 |
| 2012-06 | 88.69 | 11.31 | 0 |
| 2012-07 | 88.67 | 11.33 | 0 |
| 2012-08 | 85.84 | 12.54 | 1.6 |
| 2012-09 | 84.07 | 14.05 | 1.87 |
| 2012-10 | 84.26 | 13.76 | 1.96 |
| 2012-11 | 83.65 | 14.32 | 2.02 |
| 2012-12 | 82.75 | 15.17 | 2.06 |
| 2013-01 | 82.71 | 15.13 | 2.15 |
| 2013-02 | 81.65 | 16.14 | 2.2 |
| 2013-03 | 81.41 | 16.24 | 2.34 |
| 2013-04 | 80.76 | 16.86 | 2.37 |
| 2013-05 | 79.01 | 18.46 | 2.52 |
| 2013-06 | 76.92 | 20.4 | 2.67 |
| 2013-07 | 74.1 | 22.96 | 2.92 |
| 2013-08 | 73.62 | 23.61 | 2.76 |
| 2013-09 | 70 | 27.23 | 2.77 |
| 2013-10 | 54 | 43.75 | 2.24 |
| 2013-11 | 60.22 | 37.28 | 2.5 |
| 2013-12 | 56.79 | 40.56 | 2.64 |
| 2014-01 | 59.55 | 37.57 | 2.87 |
| 2014-02 | 61.16 | 35.87 | 2.97 |
| 2014-03 | 60.13 | 36.76 | 3.1 |
| 2014-04 | 59.44 | 37.38 | 3.17 |
| 2014-05 | 59.24 | 37.52 | 3.23 |
| 2014-06 | 60.42 | 36.28 | 3.29 |
| 2014-07 | 60 | 36.2 | 3.79 |
| 2014-08 | 58.17 | 38.18 | 3.63 |
| 2014-09 | 57.32 | 39.11 | 3.56 |
| 2014-10 | 58.8 | 37.59 | 3.6 |
| 2014-11 | 57.27 | 39.18 | 3.54 |
| 2014-12 | 54.11 | 42.13 | 3.74 |
| 2015-01 | 56.29 | 40.08 | 3.61 |
| 2015-02 | 57.75 | 38.79 | 3.45 |
| 2015-03 | 57.98 | 38.66 | 3.35 |
| 2015-04 | 57.75 | 39.08 | 3.16 |
| 2015-05 | 59.65 | 37.33 | 3.01 |
| 2015-06 | 53.69 | 42.95 | 3.35 |
| Average change rate (last 12 months) | -0.98% | 1.42% | 0.15% |
Source: StatCounter Global Stats