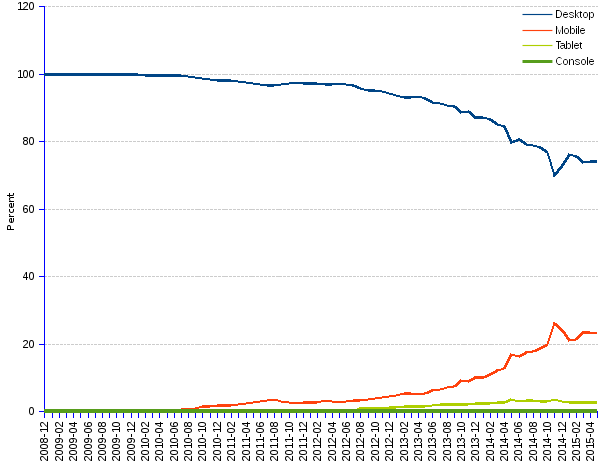
 Check also Desktop, Mobile, Tablet, Console market share trends by region :
 Check also Desktop, Mobile, Tablet, Console market share trends by region :
worldwide | Africa | Asia | Europe | North America | Oceania | South America | Switzerland.

South America shows a heavy dominance of desktop, 74% market share, and a very low presence of tablets, a share of only 2.7%.
| Date | Desktop | Mobile | Tablet | Console |
| 2008-12 | 99.86 | 0.14 | 0 | 0 |
| 2009-01 | 99.84 | 0.16 | 0 | 0 |
| 2009-02 | 99.83 | 0.17 | 0 | 0 |
| 2009-03 | 99.83 | 0.17 | 0 | 0 |
| 2009-04 | 99.84 | 0.16 | 0 | 0 |
| 2009-05 | 99.84 | 0.16 | 0 | 0 |
| 2009-06 | 99.83 | 0.17 | 0 | 0 |
| 2009-07 | 99.83 | 0.17 | 0 | 0 |
| 2009-08 | 99.83 | 0.17 | 0 | 0 |
| 2009-09 | 99.83 | 0.17 | 0 | 0 |
| 2009-10 | 99.82 | 0.18 | 0 | 0 |
| 2009-11 | 99.81 | 0.19 | 0 | 0 |
| 2009-12 | 99.78 | 0.22 | 0 | 0 |
| 2010-01 | 99.72 | 0.28 | 0 | 0 |
| 2010-02 | 99.65 | 0.35 | 0 | 0 |
| 2010-03 | 99.48 | 0.52 | 0 | 0 |
| 2010-04 | 99.52 | 0.48 | 0 | 0 |
| 2010-05 | 99.56 | 0.44 | 0 | 0 |
| 2010-06 | 99.53 | 0.47 | 0 | 0 |
| 2010-07 | 99.45 | 0.55 | 0 | 0 |
| 2010-08 | 99.27 | 0.73 | 0 | 0 |
| 2010-09 | 98.87 | 1.13 | 0 | 0 |
| 2010-10 | 98.54 | 1.46 | 0 | 0 |
| 2010-11 | 98.31 | 1.69 | 0 | 0 |
| 2010-12 | 98.12 | 1.88 | 0 | 0 |
| 2011-01 | 98.12 | 1.88 | 0 | 0 |
| 2011-02 | 98.02 | 1.98 | 0 | 0 |
| 2011-03 | 97.78 | 2.22 | 0 | 0 |
| 2011-04 | 97.6 | 2.4 | 0 | 0 |
| 2011-05 | 97.23 | 2.77 | 0 | 0 |
| 2011-06 | 96.9 | 3.1 | 0 | 0 |
| 2011-07 | 96.68 | 3.32 | 0 | 0 |
| 2011-08 | 96.48 | 3.52 | 0 | 0 |
| 2011-09 | 96.98 | 3.02 | 0 | 0 |
| 2011-10 | 97.27 | 2.73 | 0 | 0 |
| 2011-11 | 97.45 | 2.55 | 0 | 0 |
| 2011-12 | 97.2 | 2.8 | 0 | 0 |
| 2012-01 | 97.12 | 2.88 | 0 | 0 |
| 2012-02 | 97.16 | 2.84 | 0 | 0 |
| 2012-03 | 96.78 | 3.22 | 0 | 0 |
| 2012-04 | 97.03 | 2.97 | 0 | 0 |
| 2012-05 | 97.19 | 2.81 | 0 | 0 |
| 2012-06 | 97.04 | 2.96 | 0 | 0 |
| 2012-07 | 96.76 | 3.24 | 0 | 0 |
| 2012-08 | 95.6 | 3.49 | 0.88 | 0.03 |
| 2012-09 | 95.27 | 3.76 | 0.95 | 0.03 |
| 2012-10 | 95.08 | 3.9 | 0.99 | 0.03 |
| 2012-11 | 94.82 | 4.11 | 1.04 | 0.04 |
| 2012-12 | 94.23 | 4.54 | 1.19 | 0.04 |
| 2013-01 | 93.67 | 4.96 | 1.33 | 0.04 |
| 2013-02 | 93.01 | 5.4 | 1.56 | 0.03 |
| 2013-03 | 93.04 | 5.33 | 1.59 | 0.04 |
| 2013-04 | 93.36 | 5.05 | 1.55 | 0.03 |
| 2013-05 | 92.69 | 5.58 | 1.7 | 0.03 |
| 2013-06 | 91.59 | 6.43 | 1.95 | 0.03 |
| 2013-07 | 91.23 | 6.69 | 2.04 | 0.04 |
| 2013-08 | 90.63 | 7.18 | 2.14 | 0.04 |
| 2013-09 | 90.46 | 7.39 | 2.11 | 0.03 |
| 2013-10 | 88.68 | 9.15 | 2.13 | 0.03 |
| 2013-11 | 88.77 | 8.93 | 2.27 | 0.03 |
| 2013-12 | 87.27 | 10.19 | 2.51 | 0.03 |
| 2014-01 | 87.05 | 10.29 | 2.61 | 0.04 |
| 2014-02 | 86.4 | 11 | 2.56 | 0.04 |
| 2014-03 | 84.97 | 12.34 | 2.66 | 0.04 |
| 2014-04 | 84.48 | 12.82 | 2.67 | 0.04 |
| 2014-05 | 79.6 | 16.85 | 3.52 | 0.03 |
| 2014-06 | 80.56 | 16.27 | 3.14 | 0.03 |
| 2014-07 | 79.06 | 17.69 | 3.22 | 0.04 |
| 2014-08 | 78.93 | 17.75 | 3.28 | 0.04 |
| 2014-09 | 78.22 | 18.61 | 3.14 | 0.04 |
| 2014-10 | 76.82 | 19.97 | 3.18 | 0.03 |
| 2014-11 | 70 | 26.2 | 3.77 | 0.03 |
| 2014-12 | 72.81 | 23.95 | 3.21 | 0.03 |
| 2015-01 | 76.08 | 21.12 | 2.76 | 0.05 |
| 2015-02 | 75.69 | 21.52 | 2.74 | 0.05 |
| 2015-03 | 73.87 | 23.39 | 2.7 | 0.04 |
| 2015-04 | 73.99 | 23.34 | 2.63 | 0.04 |
| 2015-05 | 74 | 23.26 | 2.7 | 0.04 |
| Average change rate (last 12 months) | -0.61% | 2.72% | -2.19% | 2.43% |
Source: StatCounter Global Stats