 Check also Desktop, Mobile, Tablet, Console market share trends by region :
 Check also Desktop, Mobile, Tablet, Console market share trends by region :
worldwide | Africa | Asia | Europe | North America | Oceania | South America | Switzerland.

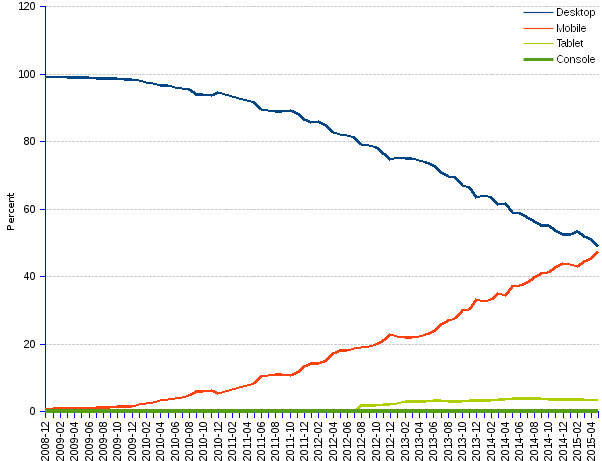
In Asia, convergence between desktop and mobile progresses fast, with 49% and 47% shares respectively, while tablets show a comparatively modest performance at less than 4%.
| Date | Desktop | Mobile | Tablet | Console |
| 2008-12 | 99.2 | 0.8 | 0 | 0 |
| 2009-01 | 99.1 | 0.9 | 0 | 0 |
| 2009-02 | 99.13 | 0.87 | 0 | 0 |
| 2009-03 | 99.08 | 0.92 | 0 | 0 |
| 2009-04 | 99.07 | 0.93 | 0 | 0 |
| 2009-05 | 99.02 | 0.98 | 0 | 0 |
| 2009-06 | 98.9 | 1.1 | 0 | 0 |
| 2009-07 | 98.8 | 1.2 | 0 | 0 |
| 2009-08 | 98.69 | 1.31 | 0 | 0 |
| 2009-09 | 98.66 | 1.34 | 0 | 0 |
| 2009-10 | 98.55 | 1.45 | 0 | 0 |
| 2009-11 | 98.48 | 1.52 | 0 | 0 |
| 2009-12 | 98.42 | 1.58 | 0 | 0 |
| 2010-01 | 97.97 | 2.03 | 0 | 0 |
| 2010-02 | 97.63 | 2.37 | 0 | 0 |
| 2010-03 | 97.12 | 2.88 | 0 | 0 |
| 2010-04 | 96.76 | 3.24 | 0 | 0 |
| 2010-05 | 96.48 | 3.52 | 0 | 0 |
| 2010-06 | 96.02 | 3.98 | 0 | 0 |
| 2010-07 | 95.72 | 4.28 | 0 | 0 |
| 2010-08 | 95.31 | 4.69 | 0 | 0 |
| 2010-09 | 94.01 | 5.99 | 0 | 0 |
| 2010-10 | 93.9 | 6.1 | 0 | 0 |
| 2010-11 | 93.76 | 6.24 | 0 | 0 |
| 2010-12 | 94.46 | 5.54 | 0 | 0 |
| 2011-01 | 93.94 | 6.06 | 0 | 0 |
| 2011-02 | 93.33 | 6.67 | 0 | 0 |
| 2011-03 | 92.77 | 7.23 | 0 | 0 |
| 2011-04 | 92.27 | 7.73 | 0 | 0 |
| 2011-05 | 91.69 | 8.31 | 0 | 0 |
| 2011-06 | 89.58 | 10.42 | 0 | 0 |
| 2011-07 | 89.33 | 10.67 | 0 | 0 |
| 2011-08 | 89.03 | 10.97 | 0 | 0 |
| 2011-09 | 88.98 | 11.02 | 0 | 0 |
| 2011-10 | 89.13 | 10.87 | 0 | 0 |
| 2011-11 | 88.22 | 11.78 | 0 | 0 |
| 2011-12 | 86.66 | 13.34 | 0 | 0 |
| 2012-01 | 85.68 | 14.32 | 0 | 0 |
| 2012-02 | 85.81 | 14.19 | 0 | 0 |
| 2012-03 | 84.82 | 15.18 | 0 | 0 |
| 2012-04 | 82.84 | 17.16 | 0 | 0 |
| 2012-05 | 81.96 | 18.04 | 0 | 0 |
| 2012-06 | 81.91 | 18.09 | 0 | 0 |
| 2012-07 | 81.2 | 18.8 | 0 | 0 |
| 2012-08 | 79.17 | 18.94 | 1.87 | 0.02 |
| 2012-09 | 78.77 | 19.32 | 1.88 | 0.02 |
| 2012-10 | 78.14 | 19.87 | 1.98 | 0.02 |
| 2012-11 | 76.61 | 21.22 | 2.14 | 0.02 |
| 2012-12 | 74.76 | 22.94 | 2.28 | 0.02 |
| 2013-01 | 75.15 | 22.3 | 2.53 | 0.02 |
| 2013-02 | 74.95 | 22.09 | 2.94 | 0.02 |
| 2013-03 | 75.04 | 21.88 | 3.06 | 0.02 |
| 2013-04 | 74.47 | 22.4 | 3.1 | 0.03 |
| 2013-05 | 73.92 | 22.9 | 3.14 | 0.03 |
| 2013-06 | 72.85 | 23.86 | 3.25 | 0.03 |
| 2013-07 | 70.97 | 25.75 | 3.25 | 0.03 |
| 2013-08 | 69.63 | 27.16 | 3.19 | 0.03 |
| 2013-09 | 69.3 | 27.52 | 3.16 | 0.02 |
| 2013-10 | 66.98 | 29.86 | 3.15 | 0.01 |
| 2013-11 | 66.37 | 30.38 | 3.24 | 0.01 |
| 2013-12 | 63.5 | 33.21 | 3.27 | 0.01 |
| 2014-01 | 64.05 | 32.6 | 3.34 | 0.01 |
| 2014-02 | 63.35 | 33.16 | 3.48 | 0.02 |
| 2014-03 | 61.29 | 35.14 | 3.56 | 0.02 |
| 2014-04 | 61.69 | 34.54 | 3.75 | 0.02 |
| 2014-05 | 59.05 | 37 | 3.94 | 0.02 |
| 2014-06 | 58.65 | 37.29 | 4.04 | 0.02 |
| 2014-07 | 57.64 | 38.37 | 3.96 | 0.02 |
| 2014-08 | 56.41 | 39.63 | 3.93 | 0.02 |
| 2014-09 | 55.06 | 41.06 | 3.87 | 0.01 |
| 2014-10 | 55.06 | 41.14 | 3.78 | 0.02 |
| 2014-11 | 53.6 | 42.65 | 3.74 | 0.01 |
| 2014-12 | 52.44 | 43.87 | 3.67 | 0.02 |
| 2015-01 | 52.6 | 43.66 | 3.72 | 0.02 |
| 2015-02 | 53.34 | 42.98 | 3.66 | 0.02 |
| 2015-03 | 51.77 | 44.61 | 3.6 | 0.01 |
| 2015-04 | 51.11 | 45.38 | 3.5 | 0.02 |
| 2015-05 | 49.01 | 47.45 | 3.53 | 0.01 |
| Average change rate (last 12 months) | -1.54% | 2.09% | -0.91% | -5.61% |
Source: StatCounter Global Stats