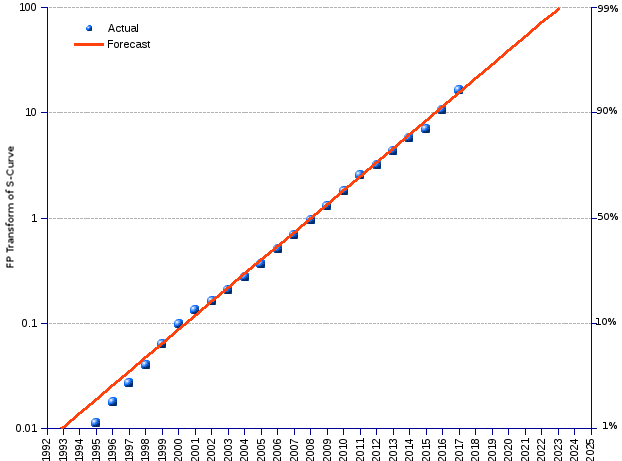
With 7.7 billion subscribers by the end of 2017, 103.4% of the world population currently hold a subscription to mobile cellular telephony on average. The market penetration of the device grew exponentially, at an annual rate of 54.7%, much faster than the population, until 2008, when it reached the inflection point. Thereafter, the change rate initiated a steady decline, with an annual average growth of 6.6% for the period 2009 to 2017, slowly closing in on final saturation.
According to areppim's most recent forecast, market saturation may occur at 8.21 billion subscriptions, somewhere in the mid-2030's. The straight red line of the chart (Fisher-Pry normalization of the logistic curve, rendering it a straight line) clearly shows the fast growth of cellular phones to saturation level, with the midpoint in 2008, and a current penetration of 94%. From now on, further global growth will mostly be commanded by sheer population growth, or alternatively by a technology quantum leap capable of taking the world out of the current cellular phone paradigm — International Telecommunications Union (ITU) seems to consider that mobile broadband Internet services can do it.
Mobile Cellular Phones | ||||||
Year |
World population |
Actual | Forecast¹ |
|||
| (million) | Subscribers (million) | Percent of population | Subscribers (million) | Percent of population | Percent market saturation | |
| 1980 | 4,449 | 0.02 | 0.001% | 1.62 | 0.04% | 0.02% |
| 1981 | 4,528 | 0.06 | 0.001% | 2.19 | 0.05% | 0.03% |
| 1982 | 4,609 | 0.10 | 0.002% | 2.97 | 0.06% | 0.04% |
| 1983 | 4,692 | 0.15 | 0.003% | 4.03 | 0.09% | 0.05% |
| 1984 | 4,776 | 0.32 | 0.01% | 5.47 | 0.11% | 0.07% |
| 1985 | 4,864 | 0.75 | 0.02% | 7.42 | 0.15% | 0.09% |
| 1986 | 4,953 | 1.45 | 0.03% | 10.1 | 0.20% | 0.12% |
| 1987 | 5,045 | 2.55 | 0.05% | 13.6 | 0.27% | 0.17% |
| 1988 | 5,138 | 4.33 | 0.08% | 18.5 | 0.36% | 0.22% |
| 1989 | 5,230 | 7.35 | 0.14% | 25.0 | 0.48% | 0.30% |
| 1990 | 5,321 | 11 | 0.21% | 33.9 | 0.64% | 0.41% |
| 1991 | 5,409 | 16 | 0.30% | 45.9 | 0.85% | 0.56% |
| 1992 | 5,495 | 23 | 0.42% | 62.2 | 1.13% | 0.76% |
| 1993 | 5,579 | 34 | 0.61% | 84.1 | 1.5% | 1.0% |
| 1994 | 5,661 | 56 | 0.99% | 113.7 | 2.0% | 1.4% |
| 1995 | 5,742 | 91 | 1.6% | 153.4 | 2.7% | 1.9% |
| 1996 | 5,821 | 145 | 2.5% | 206.7 | 3.6% | 2.5% |
| 1997 | 5,899 | 215 | 3.6% | 277.8 | 4.7% | 3.4% |
| 1998 | 5,975 | 318 | 5.3% | 372.3 | 6.2% | 4.5% |
| 1999 | 6,051 | 490 | 8.1% | 496.9 | 8.2% | 6.0% |
| 2000 | 6,128 | 738 | 12.0% | 659.8 | 10.8% | 8.0% |
| 2001 | 6,204 | 961 | 15.5% | 869.9 | 14.0% | 10.6% |
| 2002 | 6,281 | 1,157 | 18.4% | 1,137.0 | 18.1% | 13.8% |
| 2003 | 6,358 | 1,417 | 22.3% | 1,469.6 | 23.1% | 17.9% |
| 2004 | 6,436 | 1,763 | 27.4% | 1,873.7 | 29.1% | 22.8% |
| 2005 | 6,514 | 2,205 | 33.9% | 2,350.3 | 36.1% | 28.6% |
| 2006 | 6,593 | 2,745 | 41.6% | 2,892.8 | 43.9% | 35.2% |
| 2007 | 6,673 | 3,368 | 50.5% | 3,486.0 | 52.2% | 42.4% |
| 2008 | 6,754 | 4,030 | 59.7% | 4,107.0 | 60.8% | 50.0% |
| 2009 | 6,835 | 4,640 | 67.9% | 4,728.0 | 69.2% | 57.6% |
| 2010 | 6,916 | 5,290 | 76.5% | 5,321.2 | 76.9% | 64.8% |
| 2011 | 6,998 | 5,890 | 84.2% | 5,863.7 | 83.8% | 71.4% |
| 2012 | 7,080 | 6,261 | 88.4% | 6,340.3 | 89.6% | 77.2% |
| 2013 | 7,162 | 6,661 | 93.0% | 6,744.4 | 94.2% | 82.1% |
| 2014 | 7,244 | 6,996 | 96.6% | 7,077.0 | 97.7% | 86.2% |
| 2015 | 7,325 | 7,184 | 98.1% | 7,344.1 | 100.3% | 89.4% |
| 2016 | 7,405 | 7,511 | 101.4% | 7,554.2 | 102.0% | 92.0% |
| 2017 | 7,484 | 7,740 ² | 103.4% | 7,717.1 | 103.1% | 94.0% |
| 2018 | 7,563 | 7,841.7 | 103.7% | 95.5% | ||
| 2019 | 7,640 | 7,936.2 | 103.9% | 96.6% | ||
| 2020 | 7,717 | 8,007.3 | 103.8% | 97.5% | ||
| 2021 | 7,792 | 8,060.6 | 103.4% | 98.1% | ||
| 2022 | 7,867 | 8,100.3 | 103.0% | 98.6% | ||
| 2023 | 7,940 | 8,129.9 | 102.4% | 99.0% | ||
| 2024 | 8,012 | 8,151.8 | 101.7% | 99.2% | ||
| 2025 | 8,083 | 8,168.1 | 101.0% | 99.4% | ||
| Annual average growth rates : - 1980-2008 : 54.68%. - 2009-2017 : 6.61% - 1980-2017 : 41.59% - 1980-2025 : 33.26% | ||||||
| ¹ Logistic growth function ² ITU's estimate. | ||||||
Source: ITU International Telecommunications Union