![]() Gini index 1960-2012: Median, maximum and median | Inflection of the trend | Relationship to GWP |
Gini index 1960-2012: Median, maximum and median | Inflection of the trend | Relationship to GWP |

A look at the Gini index distribution since 1960 reveals two main features:
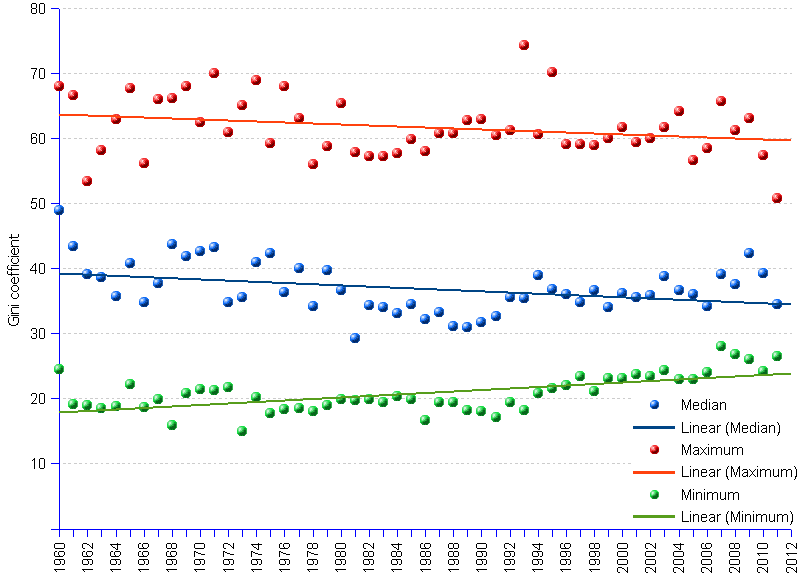
The chart shows the Gini index median, highest and lowest values from 1960 to 2012, and the corresponding regression lines. Although the incompleteness and heterogeneousness of the data command caution, the trends appear quite clearly.
Wealth of individuals cannot be meaningfully measured by GDP (gross domestic product) or other related aggregates per capita, because the latter are arithmetic averages that say nothing of the varying size of each individual's share. The Gini index however reveals how shares of income differ among the population: a low Gini value points towards a comparatively egalitarian distribution, while a high value reveals a lop-sided distribution with a huge gap between the haves and the have-nots.
The evolution of the Gini distribution parameters (maximum, median and minimum) along the years elicits three major inferences:
The concept of equality — and its corollary inequality — entail high risk when applied to the fight against poverty. They implicitly suggest that equality is the highest good, linearly opposed to the ugliest evil that is inequality. The Gini mathematical construct reinforces this very same idea, suggesting a continuous function between the Gini indexes of zero and of 100. It is not necessarily so from a real world perspective.
Outside the limited area of the basic legal rights — e.g. the right to vote, the right to buy and sell property, the right not to be convicted without trial, etc. — equality is of secondary importance economically, socially and psychologically. The reason is simple. There is a clean break separating misery or extreme poverty, if you prefer, on one side, from the continuum going from poverty to extreme wealth on the other side. The distance between the miserable and the poor is far greater and harder to resolve than the distance between the poor and the extremely rich.
Quoting Charles Péguy, the duty of pulling the extremely poor out of misery, and the duty to share the wealth evenly are not of the same order: the former is a duty of emergency, the latter is a duty of convenience. Indeed, when every man is provided with the real necessary, the bread , the shelter and the book, the distribution of luxury does not matter. Who on earth should care about the distribution of golden faucets in glittering bathrooms ?
Considering equality as the topmost goal is a double mistake. As a target, it is wrong: fairness and decency are key, not equality. As a policy, it is also wrong: the greedy and the grabbers can easily dismiss efforts to promote fraternity with the argument that inequality is a fact of life, it is designed by mother nature itself. Eradicating misery, not achieving equality, that is what society's efforts should aim at. Gini trend analysis suggests that, by misreading the agenda, the world is becoming more unequal, whatever the good intentions.
Gini Coefficient | |||||
Year | Median | Maximum | Minimum | ||
| 1960 | 49.0 | 68.0 | Kenya | 24.6 | Bulgaria |
| 1961 | 43.4 | 66.6 | Peru | 19.1 | Czechoslovakia |
| 1962 | 39.1 | 53.5 | Sweden | 19.0 | Czechoslovakia |
| 1963 | 38.7 | 58.2 | New Zealand | 18.5 | Czechoslovakia |
| 1964 | 35.8 | 63.0 | Kenya | 18.8 | Czechoslovakia |
| 1965 | 40.9 | 67.8 | Ecuador | 22.2 | Bulgaria |
| 1966 | 34.8 | 56.3 | New Zealand | 18.7 | Czechoslovakia |
| 1967 | 37.7 | 66.0 | Kenya | 19.9 | Germany |
| 1968 | 43.8 | 66.3 | Zimbabwe | 15.9 | Bulgaria |
| 1969 | 41.9 | 68.0 | Kenya | 20.9 | Bulgaria |
| 1970 | 42.6 | 62.5 | Ecuador | 21.5 | Bulgaria |
| 1971 | 43.3 | 70.0 | Kenya | 21.3 | Bulgaria |
| 1972 | 34.9 | 61.0 | Brazil | 21.8 | Bulgaria |
| 1973 | 35.6 | 65.1 | Jamaica | 15.0 | Portugal |
| 1974 | 41.0 | 69.0 | Kenya | 20.2 | Bulgaria |
| 1975 | 42.5 | 59.3 | Gabon | 17.8 | Bulgaria |
| 1976 | 36.4 | 68.0 | Kenya | 18.4 | Bulgaria |
| 1977 | 40.1 | 63.2 | Gabon | 18.6 | China |
| 1978 | 34.2 | 56.0 | Brazil | 18.0 | Australia |
| 1979 | 39.7 | 58.9 | Brazil | 19.0 | Australia |
| 1980 | 36.6 | 65.5 | Jamaica | 19.9 | Sweden |
| 1981 | 29.3 | 57.9 | Brazil | 19.7 | Sweden |
| 1982 | 34.4 | 57.3 | Kenya | 19.9 | Sweden |
| 1983 | 34.0 | 57.3 | Kenya | 19.4 | Sweden |
| 1984 | 33.1 | 57.7 | Brazil | 20.4 | Sweden |
| 1985 | 34.5 | 59.9 | Malawi | 19.9 | Czechoslovakia |
| 1986 | 32.2 | 58.1 | Brazil | 16.6 | Luxembourg |
| 1987 | 33.3 | 60.9 | Lesotho | 19.4 | Slovak Republic |
| 1988 | 31.1 | 60.9 | Brazil | 19.4 | Czech Republic |
| 1989 | 31.0 | 62.9 | Sierra Leone | 18.3 | Slovak Republic |
| 1990 | 31.8 | 63.0 | South Africa | 18.0 | Slovak Republic |
| 1991 | 32.7 | 60.5 | Zambia | 17.2 | Portugal |
| 1992 | 35.7 | 61.3 | Central African Republic | 19.5 | Slovak Republic |
| 1993 | 35.5 | 74.3 | Namibia | 18.3 | Slovak Republic |
| 1994 | 39.0 | 60.7 | Swaziland | 20.9 | Finland |
| 1995 | 36.8 | 70.3 | Zimbabwe | 21.6 | Czech Republic |
| 1996 | 36.0 | 59.1 | Brazil | 22.1 | Finland |
| 1997 | 34.8 | 59.2 | Brazil | 23.5 | Finland |
| 1998 | 36.8 | 59.0 | Brazil | 21.2 | Czech Republic |
| 1999 | 34.0 | 60.0 | Lesotho | 23.2 | Czech Republic |
| 2000 | 36.3 | 61.7 | Bolivia | 23.1 | Czech Republic |
| 2001 | 35.6 | 59.5 | Haiti | 23.7 | Czech Republic |
| 2002 | 35.9 | 60.1 | Bolivia | 23.4 | Czech Republic |
| 2003 | 38.8 | 61.8 | Ecuador | 24.3 | Slovenia |
| 2004 | 36.7 | 64.3 | Comoros | 23.0 | Sweden |
| 2005 | 36.0 | 56.7 | Honduras | 23.0 | Sweden |
| 2006 | 34.2 | 58.5 | Colombia | 24.0 | Denmark, Slovenia, Sweden |
| 2007 | 39.1 | 65.8 | Seychelles | 28.1 | Slovak Republic |
| 2008 | 37.6 | 61.3 | Honduras | 26.9 | Slovak Republic |
| 2009 | 42.4 | 63.1 | South Africa | 26.0 | Slovak Republic |
| 2010 | 39.4 | 57.5 | Colombia | 24.2 | Bangladesh |
| 2011 | 34.5 | 50.8 | Rwanda | 26.5 | Belarus |
| 2012 | n/a | n/a | n/a | ||
| Average annual change rate | -0.69% | -0.57% | 0.15% | ||
| Slope of the regression line | -0.091 | -0.079 | 0.116 | ||
![]() Gini index 1960-2012: Median, maximum and median | Inflection of the trend | Relationship to GWP |
Gini index 1960-2012: Median, maximum and median | Inflection of the trend | Relationship to GWP | 

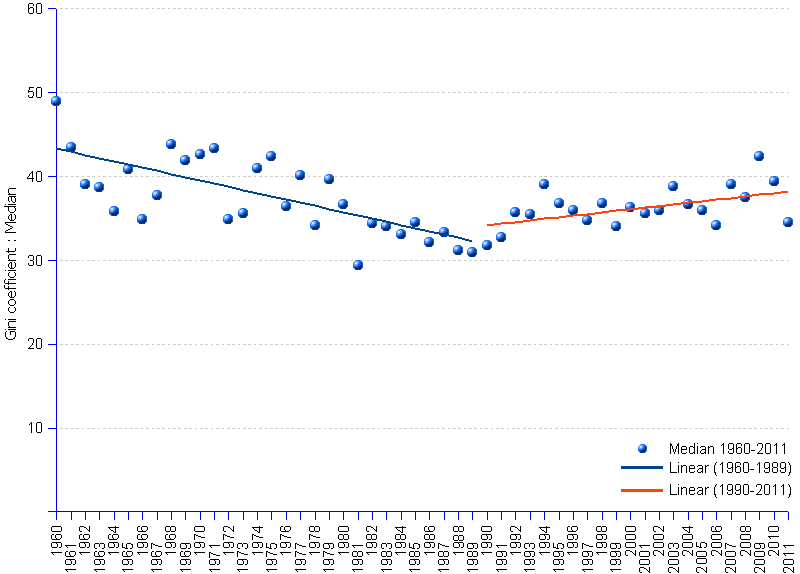
The Gini median for the period 1960 to 2011 breaks down into two distinct periods: the line follows a downward trend from 1960 through the 1980s, reaches the inflection point in 1989, and moves upwards thereafter. The first 30-year period (blue line; slope of the linear regression: -0.38%) indicates a trend towards a more egalitarian pattern. From 1990 onwards (red line; slope: 0.19), inequality reasserts itself, the line taking an ascending path. In other words, inequality remained quite resilient, and successfully reversed the egalitarian trend that had prevailed from 1960 to 1989. Relating the trend reversal to key events of the late 1980s, namely the fall of the Berlin wall, the collapse of the Soviet Union, the triumph of right wing economic policy, and the alleged "End of History" may trigger amusing thoughts.
So, inequality is triumphant — but why should one care? Setting aside the intricacies of the debate around egalitarianism or non-egalitarianism, one can point out three fairly good reasons for feeling concerned.
The economics argument helps to understand the shift taken since the late 1990s by the world economy governance from a focus on structural adjustment (basically meaning spending cuts and belt tightening), to the longer-term concern with the reduction of poverty and inequality (World Bank, 2006. World Development Report 2006 “Equity and Development”). Alas, as suggested by the trend inflection, that concern sounds like baloney: inequality is on the rise.
Gini Coefficient Median | |
Year | Gini Median |
| 1960 | 49.0 |
| 1961 | 43.4 |
| 1962 | 39.1 |
| 1963 | 38.7 |
| 1964 | 35.8 |
| 1965 | 40.9 |
| 1966 | 34.8 |
| 1967 | 37.7 |
| 1968 | 43.8 |
| 1969 | 41.9 |
| 1970 | 42.6 |
| 1971 | 43.3 |
| 1972 | 34.9 |
| 1973 | 35.6 |
| 1974 | 41.0 |
| 1975 | 42.5 |
| 1976 | 36.4 |
| 1977 | 40.1 |
| 1978 | 34.2 |
| 1979 | 39.7 |
| 1980 | 36.6 |
| 1981 | 29.3 |
| 1982 | 34.4 |
| 1983 | 34.0 |
| 1984 | 33.1 |
| 1985 | 34.5 |
| 1986 | 32.2 |
| 1987 | 33.3 |
| 1988 | 31.1 |
| 1989 | 31.0 |
| 1990 | 31.8 |
| 1991 | 32.7 |
| 1992 | 35.7 |
| 1993 | 35.5 |
| 1994 | 39.0 |
| 1995 | 36.8 |
| 1996 | 36.0 |
| 1997 | 34.8 |
| 1998 | 36.8 |
| 1999 | 34.0 |
| 2000 | 36.3 |
| 2001 | 35.6 |
| 2002 | 35.9 |
| 2003 | 38.8 |
| 2004 | 36.7 |
| 2005 | 36.0 |
| 2006 | 34.2 |
| 2007 | 39.1 |
| 2008 | 37.6 |
| 2009 | 42.4 |
| 2010 | 39.4 |
| 2011 | 34.5 |
| 2012 | n/a |
| Slope 1960-1989 | -0.38 |
| Slope 1990-2011 | 0.19 |
![]() Gini index 1960-2012: Median, maximum and median | Inflection of the trend | | Relationship to GWP |
Gini index 1960-2012: Median, maximum and median | Inflection of the trend | | Relationship to GWP | 

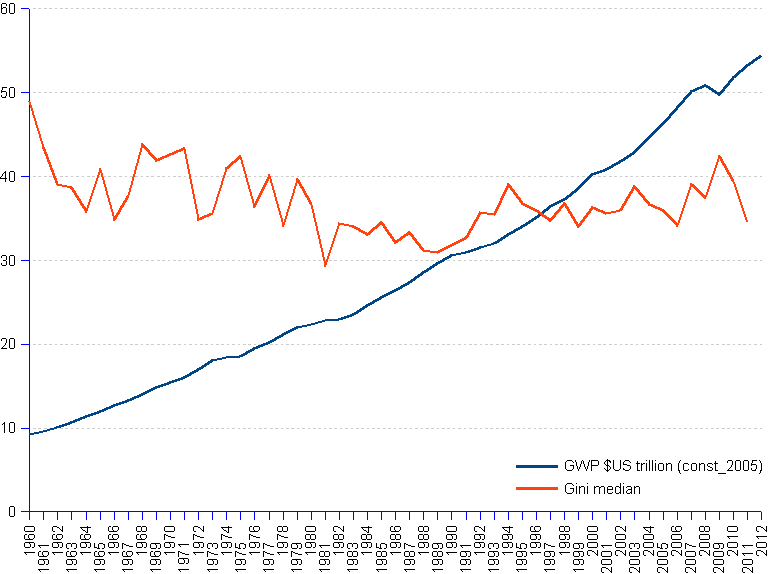
The gross world product (GWP) has increased by US$44 trillion or five fold from 1960 to 2012 — at an annual average rate of 3.5% (in US constant dollars, 2005=100). This surge of affluence should have induced not only a decrease of world poverty, but also a narrowing of the inequality gap.
Since the 1960s, the concepts of solidarity and co-operation have been reinvented as the building blocks of a prosperous and healthy society. Such social-ethnologists as Marcel Mauss, showing how gift exchanges create bonds that reinforce the social fabric, were brought back to the front stage of the societal debate. Political scientists and game theorists demonstrated that cooperation and trust can win over pure competitive strategies. Economists showed that fairness and cooperation can be not only closer to human nature than the selfish homo economicus of classical economics, but also more congruent with Darwinian success-breeding altruistic behaviors. Also, for quite a while, fear of socialism induced hardliners to give away a few crumbs in exchange for a portion of social consensus. In synch with these lines of thinking, international organizations, national governments and non-governmental organizations intensified action plans to allegedly enhance social cohesion, solidarity and fairness.
On early September 2000, a small crowd of world leaders met in the United Nations (UN) Headquarters in New York to hold the so-called Millennium Summit, the output of which was a set of 8 Millennium Development Goals (MDGs) with, at the topmost position, the aim "To eradicate extreme poverty and hunger" by 2015.
Today, the results are mixed to say the least. The World Bank (WB), while claiming that "the world has become considerably less poor in the past three decades", concedes that "global income inequality increased slightly between the late 1980s and the middle of the last decade ... Citizens and policy makers alike are concerned with growing income disparities. " (World Bank 2012. Inequality In Focus, Vol 1, Nbr 1, April 2012). While the chasm between the well-paid and the low-paid deepens and the number and wealth of billionaires go through the roof, the UN acknowledge that 1.2 billion people are still living in extreme poverty, 60.9 per cent of workers in the developing world still live on less than $4 a day, the proportion of undernourished people worldwide is 15 percent or 870 million people (The Millennium Development Goals Report 2013, United Nations, 2013), and the number of unemployed people has increased by 131.8 million since 2007, leaving 201.8 million people without jobs in 2013 (Global Employment Trends 2014, ILO, 2014). How can we reconcile the official good-intentions with such a modest performance ?
These underlying forces generate strong social and economical inefficiencies. Even supposing that the UN, IMF, WB, OECD and others' efforts to promote fairness and eradicate poverty are authentic and unbiased, it seems naive to expect much change. Their programs do not impact the deep-rooted system behavior that lavishly rewards the heavy weights while ignoring the crowds, that worships the winners while looking upon the masses as non-deserving, self-made, despicable losers. Which leaves us with two unanswered questions: how to build long-term prosperity on such a lopsided foundation? For how long will the outcasts shy away from reclaiming their fair share of the cake?
Gini Coefficient Median | ||
Year | GWP | Gini Median |
| 1960 | 9.19 | 49.00 |
| 1961 | 9.58 | 43.42 |
| 1962 | 10.11 | 39.10 |
| 1963 | 10.64 | 38.65 |
| 1964 | 11.34 | 35.80 |
| 1965 | 11.98 | 40.85 |
| 1966 | 12.68 | 34.83 |
| 1967 | 13.24 | 37.70 |
| 1968 | 14.04 | 43.78 |
| 1969 | 14.86 | 41.94 |
| 1970 | 15.45 | 42.64 |
| 1971 | 16.06 | 43.32 |
| 1972 | 16.96 | 34.90 |
| 1973 | 18.05 | 35.61 |
| 1974 | 18.38 | 41.00 |
| 1975 | 18.54 | 42.45 |
| 1976 | 19.49 | 36.44 |
| 1977 | 20.27 | 40.10 |
| 1978 | 21.14 | 34.22 |
| 1979 | 21.99 | 39.71 |
| 1980 | 22.39 | 36.65 |
| 1981 | 22.85 | 29.35 |
| 1982 | 22.94 | 34.36 |
| 1983 | 23.55 | 34.05 |
| 1984 | 24.66 | 33.10 |
| 1985 | 25.60 | 34.54 |
| 1986 | 26.43 | 32.16 |
| 1987 | 27.35 | 33.31 |
| 1988 | 28.62 | 31.15 |
| 1989 | 29.69 | 30.95 |
| 1990 | 30.54 | 31.75 |
| 1991 | 30.95 | 32.70 |
| 1992 | 31.53 | 35.68 |
| 1993 | 32.03 | 35.53 |
| 1994 | 33.04 | 39.00 |
| 1995 | 34.01 | 36.80 |
| 1996 | 35.12 | 36.00 |
| 1997 | 36.43 | 34.81 |
| 1998 | 37.33 | 36.75 |
| 1999 | 38.58 | 34.00 |
| 2000 | 40.22 | 36.30 |
| 2001 | 40.91 | 35.59 |
| 2002 | 41.76 | 35.91 |
| 2003 | 42.92 | 38.84 |
| 2004 | 44.71 | 36.70 |
| 2005 | 46.33 | 36.00 |
| 2006 | 48.22 | 34.21 |
| 2007 | 50.13 | 39.09 |
| 2008 | 50.85 | 37.57 |
| 2009 | 49.78 | 42.36 |
| 2010 | 51.77 | 39.37 |
| 2011 | 53.24 | 34.48 |
| 2012 | 54.48 | n/a |
| Annual average change | 3.50% | -0.69% |
| Change | 44.0 | -14.5 |
| Change in percent | 479.4% | -29.6% |
Sources: see World Bank, and UN University, World Income Inequality Database.
![]() areppim: information, pure and simple
areppim: information, pure and simple