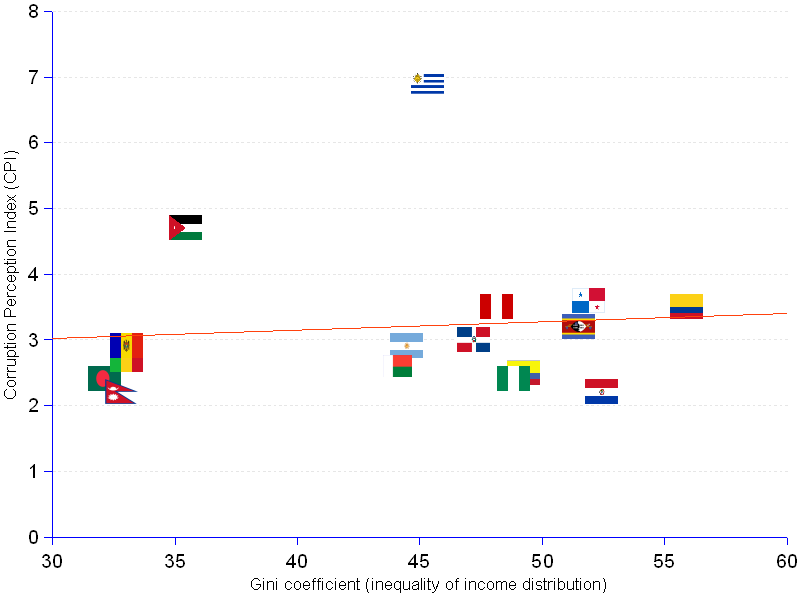
We know intuitively that there must be some relationship between corruption and inequality of income distribution. Where corruption is high, inequality must also be high and vice-verse. Previous analyzes in this site seemed to confirm this view. Data for 2004 and 2006 showed strong correlations (r = -0.85, and r = -0.71), such that the variation of one of the variables could be explained up to 72% (2004) or 50% (2006) by the variation of the other. The interesting question of determining which of corruption or inequality was the cause of which, remained moot.
Alas, data for 2010 do not corroborate the relationship. There is no — or only minimal — linear association between the two variables. The correlation coefficient is a paltry r = 0.09, justifying that only 1% of the variation of one variable can be explained by the variation of the other (R² = 0.01). Figures for 2010 do not seem to be in line with those of previous years.
This is both puzzling and embarrassing, because it contradicts the dominant view purporting a link between inequality and corruption. Did something happen that annulled the relationship in the recent years, or have we done something wrong in processing the numbers ?
Let us start by the latter, since one cannot deny that many biases smudge the analysis. In fact, the available Gini and CPI data are short on quality. From one year to the other, the number of countries included in the lists vary considerably (from 16 in 2010 to 72 countries in 2005), and the countries are never the same. Furthermore, the index values do not always measure the same reality (as cautioned in our definition of the Gini index). In other words, the samples are not in accordance with the best statistical procedures, are not strictly comparable, and therefore should not be expected to produce fully reliable inferences. They cannot deliver more than what they are made of.
Despite that, it would be interesting to know which insights a further crunching of the numbers could bring to light. From the data available for the period 1995 to 2010, two major conclusions can be drawn.
More sophisticated statistical analysis could be applied to the data, to try and understand better the association — or lack thereof — between corruption and income inequality. However, considering the limitations of the raw data previously mentioned, it does not seem very wise to use highly powerful tools to analyze very coarse material.
For the time being, let us rely on another hypothesis (3). "Not all corruption is linked to inequality. 'Grand' corruption refers to malfeasance of considerable magnitude by people who exploit their positions to get rich (or become richer) — political or business leaders. So grand corruption is all about extending the advantages of those already well endowed. 'Petty corruption', small scale payoffs to doctors, police officers, and even university professors, very common in the formerly Communist nations of Central and Eastern Europe (and many poor countries) is different in kind, if not in spirit....There is a link between inequality and corruption, but it is not direct", it is indirect, "through low generalized trust".
Ultimately, more than knowing how corruption and income inequality relate to each other, or which is the cause and which is the result, it is important to understand their effects on society and, should they be undesirable, what should be done to get rid of them.
At least as regards the first item, a wide consensus has been achieved, summarized as follows :
Getting rid of these social cancers will not be an easy task. The decade long efforts to curb corruption and inequality made by the World Bank, IMF, and other international and national organizations, simply missed the goal, as shown by the statistical trends. The job must be done otherwise and by other agents. Nothing short of a major political turn around will succeed in controlling and bringing corruption and inequality down to tolerable levels.
Relationship Between Corruption & Unequal Income Distribution | ||
Country |
Corruption Perceptions Index (CPI) |
Gini Index |
| Argentina | 2.9 | 44.49 |
| Bangladesh | 2.4 | 32.12 |
| Colombia | 3.5 | 55.91 |
| Dominican Republic | 3 | 47.2 |
| Ecuador | 2.5 | 49.26 |
| Jordan | 4.7 | 35.43 |
| Madagascar | 2.6 | 44.11 |
| Mali | 2.7 | 33.02 |
| Moldova | 2.9 | 33.03 |
| Nepal | 2.2 | 32.82 |
| Nigeria | 2.4 | 48.83 |
| Panama | 3.6 | 51.92 |
| Paraguay | 2.2 | 52.42 |
| Peru | 3.5 | 48.14 |
| Swaziland | 3.2 | 51.49 |
| Uruguay | 6.9 | 45.32 |
| Average | 3.2 | 44.09 |
| Median | 2.9 | 45.32 |
| Correlation r = 0.085 | ||
| Regression R² = 0.007 | ||
| ¹ Includes only nations for which both CPI and Gini data are available for 2010. | ||
Sources: see Transparency International, World Bank, and UN University, World Income Inequality Database.