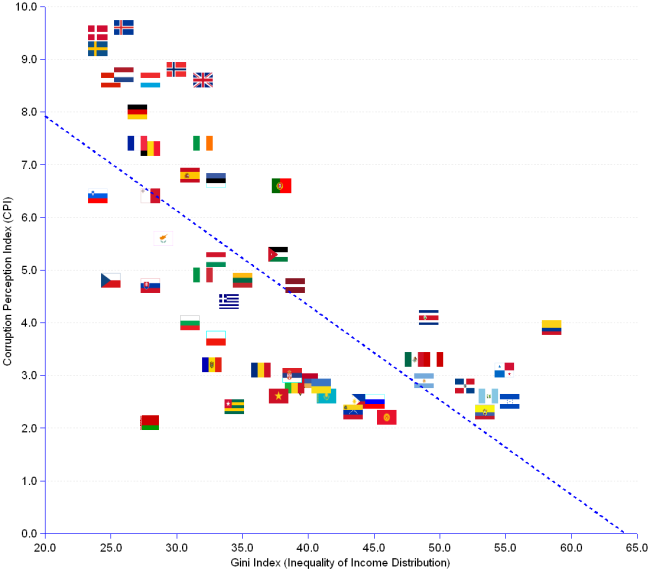

Corruption and inequality of income distribution are correlated (r = -0.71). The chart shows the scatter of 54 nations according to their individual Gini and Corruption Perception indexes in 2006. Corruption is measured by CPI (from 0.0 for highest, to 10.0 for lowest corruption), and inequality of income distribution by the Gini Index (from 0 for perfectly egalitarian, to 100 for totally inequalitarian).
The light blue dotted line is the linear regression indicating the functional relationship between the two variables. It reveals the relationship between corruption (Y-axis) and income inequality (X-axis): an increase of income inequality is accompanied by the increase of corruption.
Furthermore, the regression tells us that 50% (R² = 0.5) of the CPI variation is explained by the variation of the Gini index. The conclusion seems clear. Numerous governments and specialised organizations such as the World Bank consider corruption a scourge of mankind, responsible, among other evils, for:
This is a fair assessment. Nevertheless, in promoting the view that corruption is an output of bad governance -- an issue that can be fixed with newer legislation and the companion paraphernalia of monitorisation and control mechanisms -- they may prescribe the wrong medicine. Such an approach will surely keep attorneys, consultants and technology suppliers in business. But it is doubtful that it will achieve the level of probity that the group of nations in the upper left corner of the chart raised to by other means, namely a more egalitarian distribution of income (see also Inequality and corruption pose a threat).
Relationship Between Corruption & Unequal Income Distribution | ||
Country |
Gini Index |
Corruption Perceptions Index (CPI) |
| Argentina | 48.8 | 2.9 |
| Armenia | 40.0 | 2.9 |
| Austria | 25.0 | 8.6 |
| Belarus | 27.9 | 2.1 |
| Belgium | 28.0 | 7.3 |
| Bulgaria | 31.0 | 4.0 |
| Colombia | 58.5 | 3.9 |
| Costa Rica | 49.2 | 4.1 |
| Cyprus | 29.0 | 5.6 |
| Czech Republic | 25.0 | 4.8 |
| Denmark | 24.0 | 9.5 |
| Dominican Republic | 51.9 | 2.8 |
| Ecuador | 53.4 | 2.3 |
| Estonia | 33.0 | 6.7 |
| Finland | 26.0 | 9.6 |
| France | 27.0 | 7.4 |
| Germany | 27.0 | 8.0 |
| Greece | 34.0 | 4.4 |
| Guatemala | 53.7 | 2.6 |
| Honduras | 55.3 | 2.5 |
| Hungary | 33.0 | 5.2 |
| Iceland | 26.0 | 9.6 |
| Ireland | 32.0 | 7.4 |
| Italy | 32.0 | 4.9 |
| Jordan | 37.7 | 5.3 |
| Kazakhstan | 41.4 | 2.6 |
| Kyrgyzstan | 46.0 | 2.2 |
| Latvia | 39.0 | 4.7 |
| Lithuania | 35.0 | 4.8 |
| Luxembourg | 28.0 | 8.6 |
| Macedonia FYR | 39.4 | 2.7 |
| Mali | 39.0 | 2.8 |
| Malta | 28.0 | 6.4 |
| Mexico | 48.1 | 3.3 |
| Moldova | 32.7 | 3.2 |
| Netherlands | 26.0 | 8.7 |
| Norway | 30.0 | 8.8 |
| Panama | 54.9 | 3.1 |
| Peru | 49.6 | 3.3 |
| Philippines | 44.0 | 2.5 |
| Poland | 33.0 | 3.7 |
| Portugal | 38.0 | 6.6 |
| Romania | 36.4 | 3.1 |
| Russia | 45.1 | 2.5 |
| Serbia | 38.8 | 3.0 |
| Slovakia | 28.0 | 4.7 |
| Slovenia | 24.0 | 6.4 |
| Spain | 31.0 | 6.8 |
| Sweden | 24.0 | 9.2 |
| Togo | 34.4 | 2.4 |
| Ukraine | 41.0 | 2.8 |
| United Kingdom | 32.0 | 8.6 |
| Venezuela | 43.4 | 2.3 |
| Viet Nam | 37.8 | 2.6 |
| Average | 36.6 | 4.94 |
| Median | 34.21 | 4.25 |
| Correlation r = -0.71 | ||
| Regression R² = 0.5 | ||
| ¹ The 54 selected nations are those for which both CPI and Gini data are available for 2006. | ||
Sources: see Transparency International, World Bank, and UN University, World Income Inequality Database.