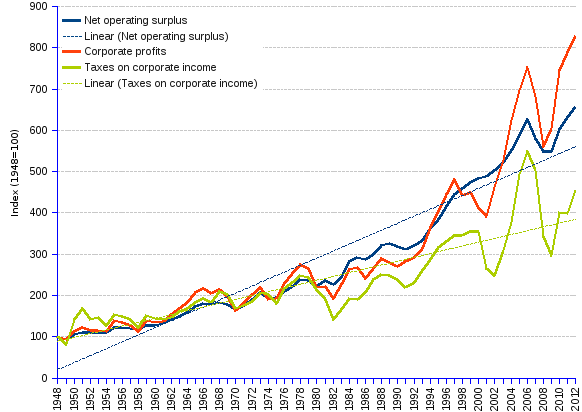

US corporate net profits before tax (Corporate profits) fared somewhat better than corporate operating profits (Net operating surplus) from 1948 to 2012, the former having grown at the average annual rate of 3.36%, against 2.99% for the latter. Corporate taxes did not benefit from the profit performance, as they grew at the lower rate of 2.39% per year. Trends emerge clearly from the regression lines (dotted lines) in the chart.
A closer analysis shows that:
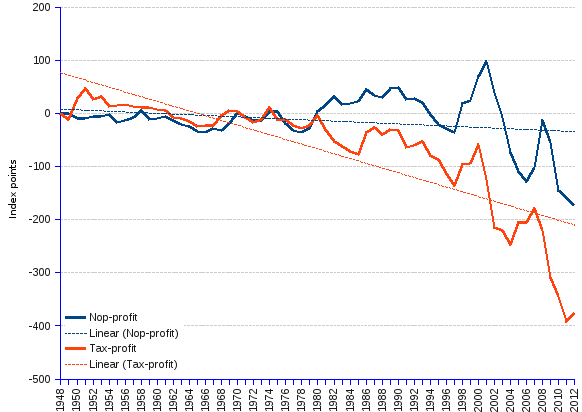
The chart below shows the variation of Net operating profits (Nop), and of Corporate taxes (Tax), relative to Net profits before tax (profit), as given by the differences (Nop-profit, and Tax-profit) between the respective values provided in the table. Trends are indicated by the regression (dotted) lines.
Corporate Performance | |||||||||
Year | Net operating surplus | Corporate profits | Taxes | Net operating surplus | Corporate profits | Taxes | Net operating surplus | Corporate profits | Taxes |
| (current USD) | (constant³ 2009 USD) | (index 1948=100) | |||||||
| 1948 | 80.1 | 31.4 | 12.4 | 588.2 | 230.6 | 91.1 | 100 | 100 | 100 |
| 1949 | 73.9 | 29.1 | 10.2 | 543.6 | 214.1 | 75.0 | 92 | 93 | 82 |
| 1950 | 85.0 | 36.1 | 17.9 | 617.8 | 262.4 | 130.1 | 105 | 114 | 143 |
| 1951 | 96.5 | 41.2 | 22.6 | 655.1 | 279.7 | 153.4 | 111 | 121 | 168 |
| 1952 | 96.9 | 39.7 | 19.4 | 646.6 | 264.9 | 129.5 | 110 | 115 | 142 |
| 1953 | 98.4 | 40.3 | 20.3 | 648.6 | 265.6 | 133.8 | 110 | 115 | 147 |
| 1954 | 99.2 | 39.5 | 17.6 | 647.8 | 258.0 | 114.9 | 110 | 112 | 126 |
| 1955 | 112.9 | 50.2 | 22.0 | 724.9 | 322.3 | 141.3 | 123 | 140 | 155 |
| 1956 | 114.9 | 49.6 | 22.0 | 713.4 | 308.0 | 136.6 | 121 | 134 | 150 |
| 1957 | 117.8 | 49.1 | 21.4 | 707.9 | 295.1 | 128.6 | 120 | 128 | 141 |
| 1958 | 117.5 | 43.9 | 19.0 | 690.4 | 258.0 | 111.6 | 117 | 112 | 123 |
| 1959 | 129.9 | 55.5 | 23.7 | 752.9 | 321.7 | 137.4 | 128 | 140 | 151 |
| 1960 | 130.9 | 54.7 | 22.8 | 748.3 | 312.7 | 130.3 | 127 | 136 | 143 |
| 1961 | 137.2 | 55.9 | 22.9 | 775.8 | 316.1 | 129.5 | 132 | 137 | 142 |
| 1962 | 149.6 | 64.0 | 24.1 | 835.6 | 357.5 | 134.6 | 142 | 155 | 148 |
| 1963 | 158.9 | 70.5 | 26.4 | 877.7 | 389.4 | 145.8 | 149 | 169 | 160 |
| 1964 | 171.2 | 77.7 | 28.2 | 931.3 | 422.7 | 153.4 | 158 | 183 | 168 |
| 1965 | 190.2 | 89.3 | 31.1 | 1,016.0 | 477.0 | 166.1 | 173 | 207 | 182 |
| 1966 | 204.8 | 96.1 | 33.9 | 1,064.1 | 499.3 | 176.1 | 181 | 217 | 193 |
| 1967 | 207.6 | 93.9 | 32.9 | 1,048.2 | 474.1 | 166.1 | 178 | 206 | 182 |
| 1968 | 221.4 | 101.7 | 39.6 | 1,072.3 | 492.6 | 191.8 | 182 | 214 | 211 |
| 1969 | 228.1 | 98.4 | 40.0 | 1,052.9 | 454.2 | 184.6 | 179 | 197 | 203 |
| 1970 | 223.2 | 86.2 | 34.8 | 978.7 | 378.0 | 152.6 | 166 | 164 | 168 |
| 1971 | 248.3 | 100.6 | 38.2 | 1,036.1 | 419.8 | 159.4 | 176 | 182 | 175 |
| 1972 | 280.6 | 117.2 | 42.3 | 1,122.2 | 468.7 | 169.2 | 191 | 203 | 186 |
| 1973 | 319.5 | 133.4 | 50.0 | 1,211.8 | 506.0 | 189.6 | 206 | 219 | 208 |
| 1974 | 326.0 | 125.7 | 52.8 | 1,134.5 | 437.5 | 183.8 | 193 | 190 | 202 |
| 1975 | 361.5 | 138.9 | 51.6 | 1,151.5 | 442.4 | 164.4 | 196 | 192 | 181 |
| 1976 | 408.1 | 174.3 | 65.3 | 1,232.2 | 526.3 | 197.2 | 209 | 228 | 217 |
| 1977 | 460.1 | 205.8 | 74.4 | 1,308.1 | 585.1 | 211.5 | 222 | 254 | 232 |
| 1978 | 528.9 | 238.6 | 84.9 | 1,405.0 | 633.8 | 225.5 | 239 | 275 | 248 |
| 1979 | 566.8 | 249.0 | 90.0 | 1,390.9 | 611.0 | 220.9 | 236 | 265 | 243 |
| 1980 | 580.8 | 223.6 | 87.2 | 1,307.4 | 503.3 | 196.3 | 222 | 218 | 216 |
| 1981 | 674.8 | 247.5 | 84.3 | 1,389.3 | 509.6 | 173.6 | 236 | 221 | 191 |
| 1982 | 687.3 | 229.9 | 66.5 | 1,332.3 | 445.7 | 128.9 | 227 | 193 | 142 |
| 1983 | 769.7 | 279.8 | 80.6 | 1,435.4 | 521.8 | 150.3 | 244 | 226 | 165 |
| 1984 | 922.8 | 337.9 | 97.5 | 1,662.0 | 608.6 | 175.6 | 283 | 264 | 193 |
| 1985 | 981.6 | 354.5 | 99.4 | 1,713.0 | 618.7 | 173.5 | 291 | 268 | 191 |
| 1986 | 985.2 | 324.4 | 109.7 | 1,685.3 | 554.9 | 187.7 | 287 | 241 | 206 |
| 1987 | 1,056.6 | 366.0 | 130.4 | 1,762.5 | 610.5 | 217.5 | 300 | 265 | 239 |
| 1988 | 1,169.8 | 414.9 | 141.6 | 1,885.3 | 668.7 | 228.2 | 321 | 290 | 251 |
| 1989 | 1,235.4 | 414.2 | 146.1 | 1,916.5 | 642.6 | 226.7 | 326 | 279 | 249 |
| 1990 | 1,255.2 | 417.2 | 145.4 | 1,877.8 | 624.1 | 217.5 | 319 | 271 | 239 |
| 1991 | 1,262.3 | 451.3 | 138.6 | 1,827.6 | 653.4 | 200.7 | 311 | 283 | 220 |
| 1992 | 1,331.4 | 475.3 | 148.7 | 1,884.7 | 672.8 | 210.5 | 320 | 292 | 231 |
| 1993 | 1,421.6 | 522.0 | 171.0 | 1,965.6 | 721.7 | 236.4 | 334 | 313 | 260 |
| 1994 | 1,577.7 | 621.9 | 193.1 | 2,135.9 | 841.9 | 261.4 | 363 | 365 | 287 |
| 1995 | 1,705.3 | 703.0 | 217.8 | 2,261.5 | 932.3 | 288.8 | 384 | 404 | 317 |
| 1996 | 1,879.0 | 786.1 | 231.5 | 2,447.2 | 1,023.8 | 301.5 | 416 | 444 | 331 |
| 1997 | 2,041.9 | 865.8 | 245.4 | 2,614.6 | 1,108.6 | 314.2 | 445 | 481 | 345 |
| 1998 | 2,137.3 | 804.1 | 248.4 | 2,707.4 | 1,018.6 | 314.7 | 460 | 442 | 346 |
| 1999 | 2,235.2 | 830.2 | 258.8 | 2,791.5 | 1,036.8 | 323.2 | 475 | 450 | 355 |
| 2000 | 2,333.4 | 781.2 | 265.1 | 2,849.4 | 954.0 | 323.7 | 484 | 414 | 356 |
| 2001 | 2,404.9 | 754.0 | 203.3 | 2,871.0 | 900.1 | 242.7 | 488 | 390 | 267 |
| 2002 | 2,510.3 | 907.2 | 192.3 | 2,951.4 | 1,066.6 | 226.1 | 502 | 463 | 248 |
| 2003 | 2,661.5 | 1,056.4 | 243.8 | 3,067.9 | 1,217.7 | 281.0 | 522 | 528 | 309 |
| 2004 | 2,887.3 | 1,283.3 | 306.1 | 3,239.4 | 1,439.8 | 343.4 | 551 | 624 | 377 |
| 2005 | 3,182.1 | 1,477.7 | 412.4 | 3,459.1 | 1,606.4 | 448.3 | 588 | 697 | 492 |
| 2006 | 3,492.3 | 1,646.5 | 473.4 | 3,683.2 | 1,736.5 | 499.3 | 626 | 753 | 548 |
| 2007 | 3,323.5 | 1,529.0 | 445.5 | 3,414.5 | 1,570.9 | 457.7 | 581 | 681 | 503 |
| 2008 | 3,199.8 | 1,285.1 | 309.1 | 3,224.4 | 1,295.0 | 311.5 | 548 | 562 | 342 |
| 2009 | 3,234.5 | 1,392.6 | 269.4 | 3,234.5 | 1,392.6 | 269.4 | 550 | 604 | 296 |
| 2010 | 3,579.9 | 1,740.6 | 370.6 | 3,537.1 | 1,719.8 | 366.2 | 601 | 746 | 402 |
| 2011 | 3,834.9 | 1,877.7 | 374.2 | 3,716.0 | 1,819.5 | 362.6 | 632 | 789 | 398 |
| 2012 | 4,060.9 | 2,009.5 | 434.8 | 3,867.5 | 1,913.8 | 414.1 | 658 | 830 | 455 |
| Average annual change rate | 6.33% | 6.71% | 5.72% | 2.99% | 3.36% | 2.39% | 2.99% | 3.36% | 2.39% |
| ¹ Business income after subtracting from revenue the costs of compensation of employees, taxes on production and imports less subsidies, and consumption of fixed capital, but before subtracting financing costs and business transfer payments. ² Corporate earnings before taxes. ³ Adjusted for inflation using the Implicit Price Deflators for GDP. | |||||||||


Sources: BEA - US Bureau of Economic Analysis.