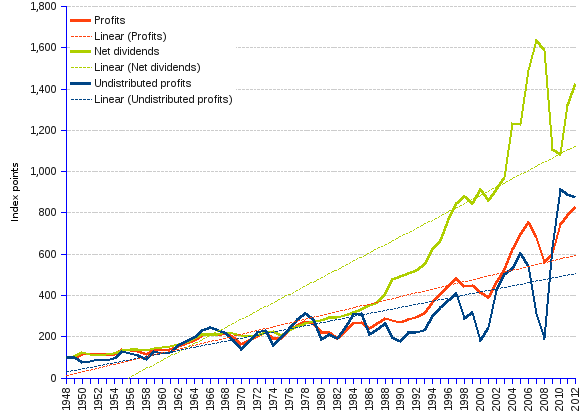

From 1948 to 2012, US corporate profits grew from USD (constant, 2009=100) 230.6 billion to 1,913.8, at the average annual rate of 3.36%. The portion of profits allocated to dividends grew, in chained USD billion, from 51.4 to 733.6, at the rate of 4.24%, and undistributed profits grew from 87.4 to 766, at the rate of 3.45%. Taken as indexes for 1948=100, the three variables stick together until the 1980s, then they grow apart, with net dividends leaving the other two variables behind — trends are given by the respective regression (dotted) lines. At a closer view, we detect two distinct stages:
Decades ago, management wisdom claimed that the keys to success were business growth, development and innovation under conditions of sound financial management, i.e. without recourse to debt that the operational results could not pay back. Undistributed profits played a crucial role in the pursuance of this strategy. They fed the treasure chest providing self-financing resources, readily available to bridge a balance-sheet gap, to escape unscathed from the occasional market storm, or to grasp business opportunities otherwise vetoed by risk-averse stakeholders. This approach demanded well-managed operations and healthy financial ratios.
The doctrine changed altogether by the turn of the 1970s, when 'maximizing shareholder value", in other terms offering shareholders high returns for their investment, was promoted to the rank of ultimate criterion of good management. Business operations became just a milking cow to immediately provide stockholders with value-growing stocks and juicy dividends. If the business can not deliver high yields, financiers will go elsewhere — the cow would better produce plenty of milk, or else it will be sold for steaks.
The "undistributed profits" approach is blamed for tarnishing the corporation's attractiveness for investors, and for putting all the eggs in the hands of the managerial class at the expenses of the owners. However "value based management", another name for the new approach, is not exempt of criticism:
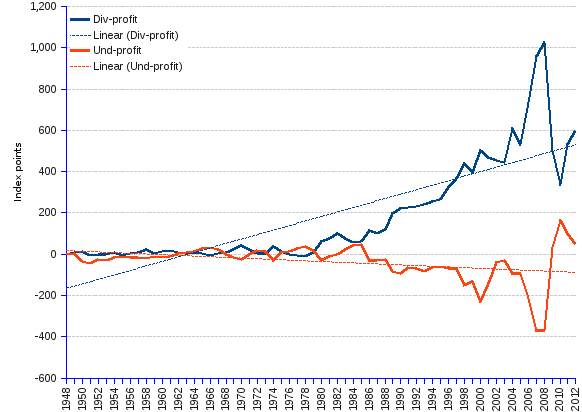
The chart below clearly shows the growing chasm between net dividends (Div) and undistributed profits (Und) relative to Net operating profits (Profit), as given by the differences (Div-profit, and Und-profit) between the respective values provided in the table. Trends are indicated by the regression (dotted) lines.
US Corporate profits ¹, Net dividends ² and Undistributed profits ³ | |||||||||
Year | Corporate profits | Net Dividends | Undistributed profits | Corporate profits | Net Dividends | Undistributed profits | Corporate profits | Net Dividends | Undistributed profits |
| (Billion current USD) | (Billion constant ⁴ 2009 USD) | (Index, 1948=100) | |||||||
| 1948 | 31.4 | 7 | 11.9 | 230.6 | 51.4 | 87.4 | 100 | 100 | 100 |
| 1949 | 29.1 | 7.2 | 11.6 | 214.1 | 53.0 | 85.3 | 93 | 103 | 98 |
| 1950 | 36.1 | 8.8 | 9.3 | 262.4 | 64.0 | 67.6 | 114 | 124 | 77 |
| 1951 | 41.2 | 8.6 | 10.1 | 279.7 | 58.4 | 68.6 | 121 | 114 | 78 |
| 1952 | 39.7 | 8.6 | 11.7 | 264.9 | 57.4 | 78.1 | 115 | 112 | 89 |
| 1953 | 40.3 | 8.9 | 11.1 | 265.6 | 58.7 | 73.2 | 115 | 114 | 84 |
| 1954 | 39.5 | 9.3 | 12.6 | 258.0 | 60.7 | 82.3 | 112 | 118 | 94 |
| 1955 | 50.2 | 10.5 | 17.6 | 322.3 | 67.4 | 113.0 | 140 | 131 | 129 |
| 1956 | 49.6 | 11.3 | 16.4 | 308.0 | 70.2 | 101.8 | 134 | 136 | 117 |
| 1957 | 49.1 | 11.7 | 16 | 295.1 | 70.3 | 96.1 | 128 | 137 | 110 |
| 1958 | 43.9 | 11.6 | 13.3 | 258.0 | 68.2 | 78.2 | 112 | 133 | 89 |
| 1959 | 55.5 | 12.6 | 19.2 | 321.7 | 73.0 | 111.3 | 140 | 142 | 127 |
| 1960 | 54.7 | 13.4 | 18.5 | 312.7 | 76.6 | 105.8 | 136 | 149 | 121 |
| 1961 | 55.9 | 13.9 | 19.2 | 316.1 | 78.6 | 108.6 | 137 | 153 | 124 |
| 1962 | 64 | 15 | 24.9 | 357.5 | 83.8 | 139.1 | 155 | 163 | 159 |
| 1963 | 70.5 | 16.2 | 27.9 | 389.4 | 89.5 | 154.1 | 169 | 174 | 176 |
| 1964 | 77.7 | 18.2 | 31.4 | 422.7 | 99.0 | 170.8 | 183 | 193 | 195 |
| 1965 | 89.3 | 20.2 | 38 | 477.0 | 107.9 | 203.0 | 207 | 210 | 232 |
| 1966 | 96.1 | 20.7 | 41.6 | 499.3 | 107.6 | 216.1 | 217 | 209 | 247 |
| 1967 | 93.9 | 21.5 | 39.5 | 474.1 | 108.6 | 199.4 | 206 | 211 | 228 |
| 1968 | 101.7 | 23.5 | 38.6 | 492.6 | 113.8 | 187.0 | 214 | 221 | 214 |
| 1969 | 98.4 | 24.2 | 34.2 | 454.2 | 111.7 | 157.9 | 197 | 217 | 181 |
| 1970 | 86.2 | 24.3 | 27.2 | 378.0 | 106.6 | 119.3 | 164 | 207 | 136 |
| 1971 | 100.6 | 25 | 37.5 | 419.8 | 104.3 | 156.5 | 182 | 203 | 179 |
| 1972 | 117.2 | 26.8 | 48 | 468.7 | 107.2 | 192.0 | 203 | 209 | 220 |
| 1973 | 133.4 | 29.9 | 53.5 | 506.0 | 113.4 | 202.9 | 219 | 221 | 232 |
| 1974 | 125.7 | 33.2 | 39.7 | 437.5 | 115.5 | 138.2 | 190 | 225 | 158 |
| 1975 | 138.9 | 33 | 54.3 | 442.4 | 105.1 | 173.0 | 192 | 204 | 198 |
| 1976 | 174.3 | 39 | 70 | 526.3 | 117.8 | 211.4 | 228 | 229 | 242 |
| 1977 | 205.8 | 44.8 | 86.6 | 585.1 | 127.4 | 246.2 | 254 | 248 | 282 |
| 1978 | 238.6 | 50.8 | 102.9 | 633.8 | 135.0 | 273.4 | 275 | 263 | 313 |
| 1979 | 249 | 57.5 | 101.4 | 611.0 | 141.1 | 248.8 | 265 | 275 | 285 |
| 1980 | 223.6 | 64.1 | 72.3 | 503.3 | 144.3 | 162.7 | 218 | 281 | 186 |
| 1981 | 247.5 | 73.8 | 89.4 | 509.6 | 151.9 | 184.1 | 221 | 296 | 211 |
| 1982 | 229.9 | 77.7 | 85.6 | 445.7 | 150.6 | 165.9 | 193 | 293 | 190 |
| 1983 | 279.8 | 83.5 | 115.7 | 521.8 | 155.7 | 215.8 | 226 | 303 | 247 |
| 1984 | 337.9 | 90.8 | 149.5 | 608.6 | 163.5 | 269.2 | 264 | 318 | 308 |
| 1985 | 354.5 | 97.5 | 157.5 | 618.7 | 170.2 | 274.9 | 268 | 331 | 315 |
| 1986 | 324.4 | 106.2 | 108.5 | 554.9 | 181.7 | 185.6 | 241 | 353 | 212 |
| 1987 | 366 | 112.3 | 123.2 | 610.5 | 187.3 | 205.5 | 265 | 364 | 235 |
| 1988 | 414.9 | 129.9 | 143.3 | 668.7 | 209.4 | 231.0 | 290 | 407 | 264 |
| 1989 | 414.2 | 158 | 110.2 | 642.6 | 245.1 | 171.0 | 279 | 477 | 196 |
| 1990 | 417.2 | 169.1 | 102.7 | 624.1 | 253.0 | 153.6 | 271 | 492 | 176 |
| 1991 | 451.3 | 180.5 | 132.2 | 653.4 | 261.3 | 191.4 | 283 | 508 | 219 |
| 1992 | 475.3 | 189.5 | 137.1 | 672.8 | 268.2 | 194.1 | 292 | 522 | 222 |
| 1993 | 522 | 205.3 | 145.6 | 721.7 | 283.9 | 201.3 | 313 | 552 | 230 |
| 1994 | 621.9 | 236 | 192.8 | 841.9 | 319.5 | 261.0 | 365 | 622 | 299 |
| 1995 | 703 | 259 | 226.2 | 932.3 | 343.5 | 300.0 | 404 | 668 | 343 |
| 1996 | 786.1 | 303.5 | 251.1 | 1,023.8 | 395.3 | 327.0 | 444 | 769 | 374 |
| 1997 | 865.8 | 339.5 | 280.9 | 1,108.6 | 434.7 | 359.7 | 481 | 846 | 412 |
| 1998 | 804.1 | 357.1 | 198.7 | 1,018.6 | 452.3 | 251.7 | 442 | 880 | 288 |
| 1999 | 830.2 | 347.9 | 223.5 | 1,036.8 | 434.5 | 279.1 | 450 | 845 | 319 |
| 2000 | 781.2 | 384.7 | 131.4 | 954.0 | 469.8 | 160.5 | 414 | 914 | 184 |
| 2001 | 754 | 370.6 | 180.2 | 900.1 | 442.4 | 215.1 | 390 | 861 | 246 |
| 2002 | 907.2 | 400.2 | 314.7 | 1,066.6 | 470.5 | 370.0 | 463 | 915 | 423 |
| 2003 | 1056.4 | 434 | 378.6 | 1,217.7 | 500.3 | 436.4 | 528 | 973 | 499 |
| 2004 | 1283.3 | 564.1 | 413.2 | 1,439.8 | 632.9 | 463.6 | 624 | 1,231 | 531 |
| 2005 | 1477.7 | 580.5 | 484.8 | 1,606.4 | 631.0 | 527.0 | 697 | 1,228 | 603 |
| 2006 | 1646.5 | 726 | 447.1 | 1,736.5 | 765.7 | 471.5 | 753 | 1,490 | 540 |
| 2007 | 1529 | 818.9 | 264.6 | 1,570.9 | 841.3 | 271.8 | 681 | 1,637 | 311 |
| 2008 | 1285.1 | 808.6 | 167.3 | 1,295.0 | 814.8 | 168.6 | 562 | 1,585 | 193 |
| 2009 | 1392.6 | 568.7 | 554.4 | 1,392.6 | 568.7 | 554.4 | 604 | 1,106 | 634 |
| 2010 | 1740.6 | 563.9 | 806 | 1,719.8 | 557.2 | 796.4 | 746 | 1,084 | 911 |
| 2011 | 1877.7 | 701.6 | 801.9 | 1,819.5 | 679.9 | 777.0 | 789 | 1,323 | 889 |
| 2012 | 2009.5 | 770.3 | 804.3 | 1,913.8 | 733.6 | 766.0 | 830 | 1,427 | 877 |
| Average annual change rate | 6.71% | 7.62% | 6.81% | 3.36% | 4.24% | 3.45% | 3.36% | 4.24% | 3.45% |
| ¹ Corporate earnings before taxes. ² Dividends are payments in cash or other assets, excluding the corporation's own stock, made by corporations to stockholders. To avoid double counting, dividends received by US corporations are subtracted from all dividends paid by corporations located in the US and abroad to stockholders who are US residents. ³ The portion of corporate profits that remains after taxes and dividends have been paid. Undistributed profits feed the corporation's reserves for ulterior self-financing. ⁴ Adjusted for inflation using the Implicit Price Deflators for GDP. | |||||||||


Sources: see BEA - US Bureau of Economic Analysis