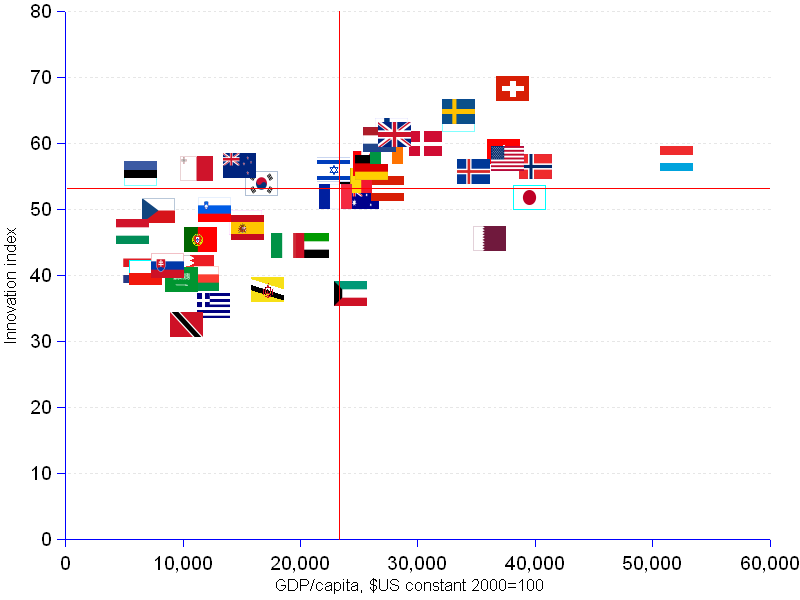

The chart shows the scatter of the innovation score for HI (high income group according to the World Bank classification) countries as a function of the GDP (gross domestic product) per capita, in $US constant, 2000=100. The red lines show the median GDP per capita (vertical) — $22,938 —, and the median innovation score (horizontal) — 52.5.
The top right quadrant includes countries that have both GDP per capita and innovation score above median. They are the super performers. This 17-strong group is mainly populated by small or very small countries such as Luxembourg, Iceland, Finland or Switzerland, not endowed with plethora of natural resources. Only 4 big countries manage to sneak in the group : United States, United Kingdom, Germany and Canada.
Even amongst high income and high innovative countries, the smaller ones seem to achieve higher performances than the heavyweights. Other small countries — Malta, Estonia — are to be found in the low GDP per capita-high innovation top left quadrant, thus corroborating the idea that small countries are adept to outperform large ones as innovation is concerned.
Abundant natural resources — the case of Brunei, Oman, Bahrain, Qatar, Saudi Arabia, UAE or Kuwait — may endow the owner countries with the means to build highly innovative social systems, but are not necessarily conducive to that end. Indeed, their innovation scores are disappointingly below the median. Living on a rent does not appear to be a strong enough stimulus to induce high performance.
In the realm of innovation, being penniless is surely a hindrance; but lavish resources may not help a lot either.
Global Innovation Index | ||||
Country |
Rank |
Income group¹ |
GDP per capita |
InnovationáScore |
| Australia | 23 | HI | 25,351 | 51.9 |
| Austria | 22 | HI | 27,428 | 53.1 |
| Bahrain | 41 | HI | 11,236³ | 41.1 |
| Belgium | 20 | HI | 24,734 | 54.3 |
| Brunei Darussalam | 53 | HI | 17,225³ | 37.7 |
| Canada | 12 | HI | 25,933 | 56.9 |
| Croatia | 42 | HI | 6,352 | 40.7 |
| Cyprus | 28 | HI | 15,378 | 47.9 |
| Czech Republic | 27 | HI | 7,912 | 49.7 |
| Denmark | 7 | HI | 30,687 | 59.9 |
| Estonia | 19 | HI | 6,438 | 55.3 |
| Finland | 4 | HI | 27,766 | 61.8 |
| France | 24 | HI | 23,017 | 51.8 |
| Germany | 15 | HI | 26,081 | 56.2 |
| Greece | 66 | HI | 12,653 | 35.3 |
| Hong Kong | 8 | HI | 37,352 | 58.7 |
| Hungary | 31 | HI | 5,746 | 46.5 |
| Iceland | 18 | HI | 34,812 | 55.7 |
| Ireland | 9 | HI | 27,329 | 58.7 |
| Israel | 17 | HI | 22,860 | 56 |
| Italy | 36 | HI | 18,935 | 44.5 |
| Japan | 25 | HI | 39,578 | 51.7 |
| Korea, Rep. | 21 | HI | 16,684 | 53.9 |
| Kuwait | 55 | HI | 24,286 | 37.2 |
| Luxembourg | 11 | HI | 52,086 | 57.7 |
| Malta | 16 | HI | 11,214 | 56.1 |
| Netherlands | 6 | HI | 26,735 | 60.5 |
| New Zealand | 13 | HI | 14,880³ | 56.6 |
| Norway | 14 | HI | 40,035 | 56.4 |
| Oman | 47 | HI | 11,701 | 39.5 |
| Poland | 44 | HI | 6,854 | 40.4 |
| Portugal | 35 | HI | 11,559 | 45.3 |
| Qatar | 33 | HI | 36,153 | 45.5 |
| Saudi Arabia | 48 | HI | 9,914 | 39.3 |
| Singapore | 3 | HI | 33,530 | 63.5 |
| Slovakia | 40 | HI | 8,694 | 41.4 |
| Slovenia | 26 | HI | 12,689 | 49.9 |
| Spain | 29 | HI | 15,512 | 47.2 |
| Sweden | 2 | HI | 33,513 | 64.8 |
| Switzerland | 1 | HI | 38,060 | 68.2 |
| Trinidad &Tobago | 81 | HI | 10,329 | 32.5 |
| United Arab Emirates | 37 | HI | 21,058 | 44.4 |
| United Kingdom | 5 | HI | 28,033 | 61.2 |
| United States | 10 | HI | 37,691 | 57.7 |
| Median | 22,938 | 52.5 | ||
| ¹ The World Bank divides world economies in "income groups", according to 2010 gross national income (GNI) per capita. The groups are : low income, $1,005 or less; lower middle income, $1,006 - $3,975; upper middle income, $3,976 - $12,275; and high income, $12,276 or more. | ||||
| ² World Bank latest available data : 2011. | ||||
| ³ World Bank latest available data : 2010. | ||||
Sources: INSEAD - WIPO for the innovation index, and World DataBank ľ The World Bank for GDP per capita.