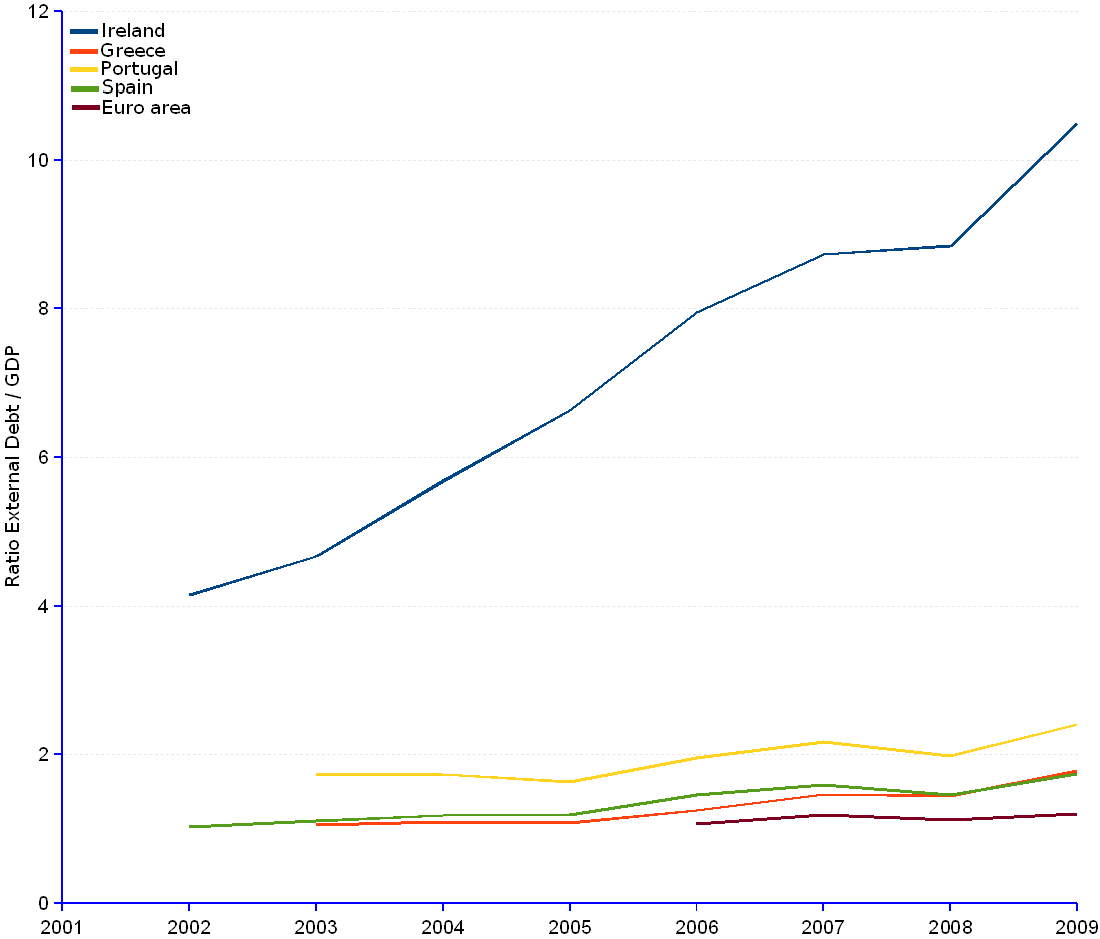

The ratio of gross external debt to GDP provides an indication of the slack of an economy to reshuffle the allocation of resources – e.g. national income, investment, fiscal revenue, domestic savings, labor and capital. Instead of promoting consumption, unproductive investment or investment in non-exportable goods and services, the economy may shift resources in favor of exports, therefore generating income streams from foreign countries that can be used to service and amortize the external debt. The lower the ratio, the more options to choose from. The higher the ratio, the lesser slack of the economy and the higher risk of default.
Ireland is in a critical spot, with a ratio of 10.5, growing at an average annual rate of 14.2% that corresponds to a doubling time of only 5 years. Ireland, not only has a ratio much higher than the other group members, but it is the only economy not to register the trend inversion caused by the 2008 general economy crunch – only a slowdown –. The reason is that, while Irish GDP grew by 2.6% (6.6 billion US$) from 2007 to 2008, the external debt grew much faster by 3.9% (88.3 billion US$). It is revealing that, in 2009, Ireland's GDP was 16% of Spain's, but the foreign bank exposure amounted to 77% of Spain's.
The problem for Ireland, Portugal and Greece is compounded by the relative small size of the economies, furthermore suffering from recession or stagnation that keeps their GDP stuck to the ground. In the context of both recession or stagnation, and high debt/GDP ratio, the economy may start a positive feedback loop, by which things go from bad to worse. Austerity rendered necessary to repay debt will feed the stagnation, thus imposing more austerity that will generate further stagnation...The coming years will be harsh for these nations from all points of view: financial, economic and social.
PIGS (Portugal, Ireland, Greece, Spain) | ||||||||||||
Year |
Portugal |
Ireland |
Greece |
Spain |
||||||||
| Gross external debt | GDP | Ratio External debt / GDP |
Gross external debt | GDP | Ratio External debt / GDP |
Gross external debt | GDP | Ratio External debt / GDP |
Gross external debt | GDP | Ratio External debt / GDP |
|
| (Million current US$) | (Million current US$) | (Million current US$) | (Million current US$) | |||||||||
| 1999 | 121,662 | 96,421 | 134,408 | 617,880 | ||||||||
| 2000 | 112,650 | 96,596 | 125,558 | 580,673 | ||||||||
| 2001 | 115,712 | 104,688 | 131,032 | 609,108 | ||||||||
| 2002 | 127,455 | 508,068 | 122,520 | 4.15 | 147,388 | 708,055 | 686,247 | 1.03 | ||||
| 2003 | 270,454 | 156,413 | 1.73 | 734,333 | 157,384 | 4.67 | 204,577 | 193,465 | 1.06 | 979,794 | 883,667 | 1.11 |
| 2004 | 310,627 | 178,960 | 1.74 | 1,052,149 | 185,131 | 5.68 | 253,287 | 230,719 | 1.1 | 1,235,322 | 1,044,299 | 1.18 |
| 2005 | 302,220 | 185,449 | 1.63 | 1,336,187 | 201,576 | 6.63 | 262,954 | 242,956 | 1.08 | 1,350,105 | 1,130,170 | 1.19 |
| 2006 | 381,453 | 195,005 | 1.96 | 1,763,130 | 221,741 | 7.95 | 329,782 | 264,018 | 1.25 | 1,804,654 | 1,234,768 | 1.46 |
| 2007 | 483,916 | 223,163 | 2.17 | 2,267,387 | 259,706 | 8.73 | 454,200 | 309,917 | 1.47 | 2,301,967 | 1,440,837 | 1.6 |
| 2008 | 484,710 | 243,839 | 1.99 | 2,355,639 | 266,329 | 8.84 | 504,612 | 350,300 | 1.44 | 2,326,273 | 1,594,466 | 1.46 |
| 2009 | 548,134 | 227,676 | 2.41 | 2,384,730 | 227,193 | 10.5 | 587,562 | 329,924 | 1.78 | 2,545,095 | 1,460,250 | 1.74 |
| 2010-Q1 | 537,585 | 2,255,759 | 556,707 | 2,409,824 | ||||||||
| 2010-Q2 | 497,762 | 2,131,267 | 532,934 | 2,165,945 | ||||||||
| Average annual change rate | 5.68% | 14.18% | 9.02% | 7.78% | ||||||||
Sources: JEDH for external debt, and World DataBank for balance of payments items.