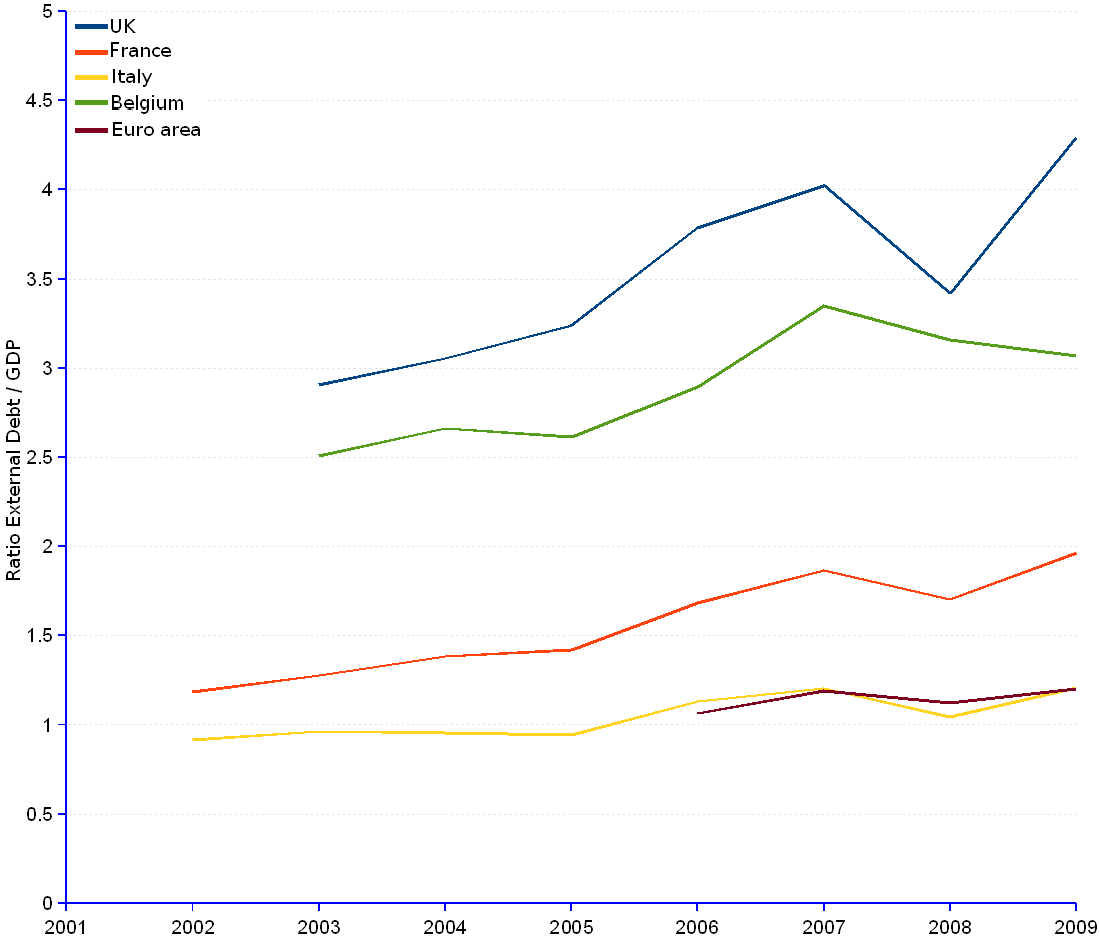

It is common knowledge that the PIGS group struggle with high debt and a public image of incarnating a high insolvency risk. And yet, considering the foreign debt to GDP ratio, they are in a better situation than other European countries, such as UK, France or Belgium.
Germany, the powerhouse of Europe on which shoulders currently rests the responsibility for protecting the Euro currency and the economic viability of the Euro area, has solid reasons to feel most concerned.
OEA (Other European Areas) | ||||||||||||
Year |
UK |
France |
Italy |
Belgium |
||||||||
| Gross external debt | GDP | Ratio External debt / GDP |
Gross external debt | GDP | Ratio External debt / GDP |
Gross external debt | GDP | Ratio External debt / GDP |
Gross external debt | GDP | Ratio External debt / GDP |
|
| (Million current US$) | (Million current US$) | (Million current US$) | (Million current US$) | |||||||||
| 1999 | 1,502,556 | 1,457,454 | 1,200,822 | 253,833 | ||||||||
| 2000 | 1,477,581 | 1,327,964 | 1,097,344 | 231,934 | ||||||||
| 2001 | 1,470,891 | 1,339,763 | 1,117,358 | 231,663 | ||||||||
| 2002 | 1,612,056 | 1,726,658 | 1,457,326 | 1.18 | 1,116,957 | 1,218,921 | 0.92 | 251,884 | ||||
| 2003 | 5,406,413 | 1,860,810 | 2.91 | 2,300,666 | 1,800,016 | 1.28 | 1,452,122 | 1,507,171 | 0.96 | 777,777 | 310,074 | 2.51 |
| 2004 | 6,729,485 | 2,202,490 | 3.06 | 2,851,561 | 2,061,412 | 1.38 | 1,647,918 | 1,727,825 | 0.95 | 961,460 | 361,110 | 2.66 |
| 2005 | 7,385,985 | 2,280,114 | 3.24 | 3,052,297 | 2,146,530 | 1.42 | 1,675,759 | 1,777,694 | 0.94 | 984,755 | 376,617 | 2.61 |
| 2006 | 9,239,287 | 2,439,424 | 3.79 | 3,817,630 | 2,266,137 | 1.68 | 2,108,044 | 1,863,381 | 1.13 | 1,155,691 | 399,168 | 2.90 |
| 2007 | 11,260,597 | 2,799,040 | 4.02 | 4,841,930 | 2,594,012 | 1.87 | 2,549,297 | 2,116,202 | 1.20 | 1,535,057 | 458,432 | 3.35 |
| 2008 | 9,106,737 | 2,662,652 | 3.42 | 4,862,662 | 2,854,229 | 1.70 | 2,395,317 | 2,296,629 | 1.04 | 1,595,147 | 504,890 | 3.16 |
| 2009 | 9,337,345 | 2,174,530 | 4.29 | 5,204,518 | 2,649,390 | 1.96 | 2,551,151 | 2,112,780 | 1.21 | 1,436,925 | 468,552 | 3.07 |
| 2010-Q1 | 9,182,070 | 5,127,836 | 2,456,813 | 1,310,850 | ||||||||
| 2011-Q2 | 8,980,793 | 4,698,162 | 2,223,403 | 1,241,221 | ||||||||
| Average annual change rate | 6.68% | 7.52% | 3.99% | 3.41% | ||||||||
Sources: JEDH for external debt, and World DataBank for balance of payments items.