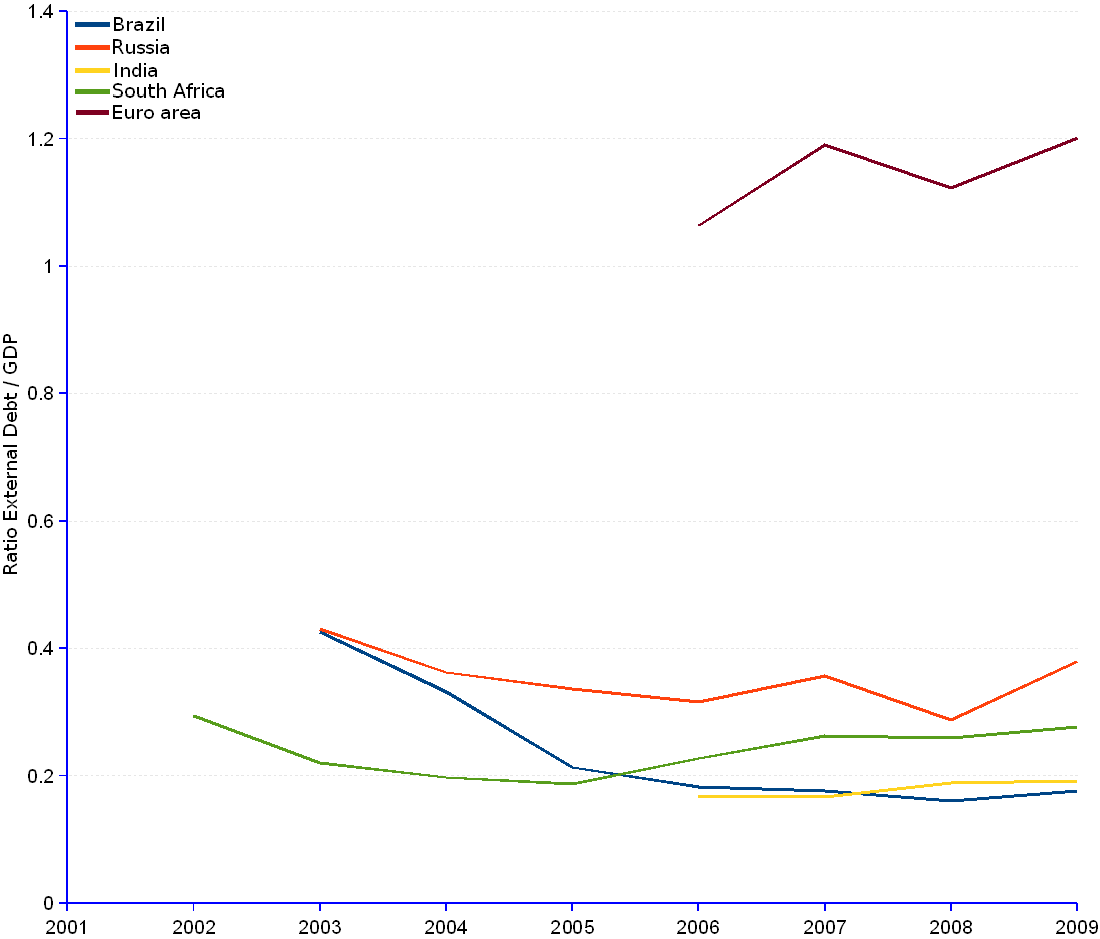

The fast growing emerging BRICS economies exhibit a low insolvency risk, as suggested by the very low Debt-to-GDP ratios. By comparison with the Euro Area, they perform 3 to 6 times better.
Contrary to most of the industrial countries, the 2008 crisis did not hinder significantly the solvency levels of the BRICS. Indeed in countries such as Brazil, Russia and South Africa, not to mention China for which comparable data are not available, the ratio indicates an ongoing financial improvement.
BRICS (Brazil, Russia, India, China¹, South Africa) | ||||||||||||
Year |
Brazil |
Russia |
India |
South Africa |
||||||||
| Gross external debt | GDP | Ratio External debt / GDP |
Gross external debt | GDP | Ratio External debt / GDP |
Gross external debt | GDP | Ratio External debt / GDP |
Gross external debt | GDP | Ratio External debt / GDP |
|
| (Million current US$) | (Million current US$) | (Million current US$) | (Million current US$) | |||||||||
| 1999 | 586,863 | 195,906 | 450,476 | 133,184 | ||||||||
| 2000 | 644,702 | 259,708 | 460,182 | 132,878 | ||||||||
| 2001 | 553,582 | 306,603 | 477,849 | 118,479 | ||||||||
| 2002 | 504,221 | 345,470 | 507,190 | 32,728 | 111,101 | 0.29 | ||||||
| 2003 | 235,414 | 552,469 | 0.43 | 185,741 | 431,487 | 0.43 | 599,461 | 37,138 | 168,219 | 0.22 | ||
| 2004 | 220,182 | 663,760 | 0.33 | 214,503 | 591,742 | 0.36 | 720,909 | 43,334 | 219,093 | 0.20 | ||
| 2005 | 187,987 | 882,185 | 0.21 | 257,402 | 764,554 | 0.34 | 837,195 | 46,157 | 247,064 | 0.19 | ||
| 2006 | 199,372 | 1,088,917 | 0.18 | 313,176 | 989,426 | 0.32 | 160,242 | 949,192 | 0.17 | 59,396 | 261,007 | 0.23 |
| 2007 | 240,495 | 1,365,983 | 0.18 | 463,915 | 1,300,121 | 0.36 | 206,005 | 1,232,816 | 0.17 | 75,275 | 286,302 | 0.26 |
| 2008 | 262,910 | 1,638,609 | 0.16 | 480,541 | 1,667,599 | 0.29 | 229,799 | 1,214,212 | 0.19 | 71,811 | 276,451 | 0.26 |
| 2009 | 277,563 | 1,571,979 | 0.18 | 467,230 | 1,230,726 | 0.38 | 252,298 | 1,310,171 | 79,253 | 285,983 | 0.28 | |
| 2010-Q1 | 293,005 | 463,754 | 262,252 | 81,729 | ||||||||
| 2010-Q2 | 309,510 | 456,060 | 273,078 | 80,516 | ||||||||
| Average annual change rate | -13.51% | -2.04% | 3.78% | -0.50% | ||||||||
| ¹ The acronym BRICS stands for Brazil, Russia, India, China and South Africa. Unfortunately, data for China is unavailable. | ||||||||||||
Sources: JEDH for external debt, and World DataBank for balance of payments items.