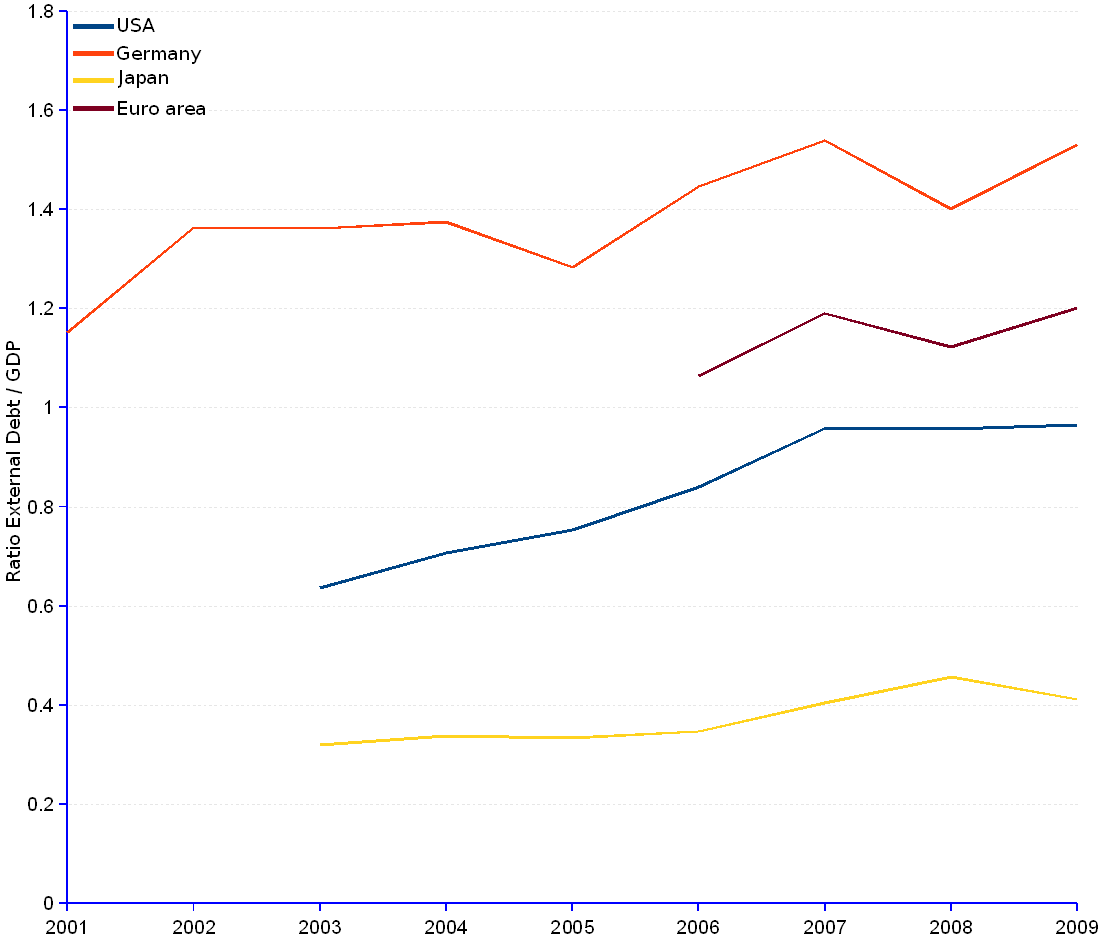

Exception made of the BRICS group, the selected large economies, possibly because they are just large, have low external debt to GDP ratios compared with other troubled economies. Therefore, they have theoretically the means to overcome foreign debt by reallocating resources to exports.
The 2008 economic crisis halted GDP growth – except for Japan where the slowdown happened already in 2004 – and had a negative impact on the ratio. However, the discipline imposed by Germany and the Euro area on their financials brought down the external debt in the first half of 2010, thus creating the conditions to an improved ratio. Recent reports indicate that at least Germany is taking advantage of the changed environment to successfully enhance exports, which can be beneficial for the whole of the Euro area too.
The US took a different course altogether. Instead of putting the brakes on the irresistible ascent of foreign debt, the US authorities took the option of allowing the dollar value to slip away by lavishly printing money – known in the financial dialect as QE or "quantitative easing", of which a huge QE1 took place beginning of 2909 and a QE2 in November 2010 – , while persuading the rest of the world to receive soft money in exchange for hard imports. Such a policy could never be accepted from a small power, but who on earth is willing to challenge the mighty States?
Selected Large Economies | ||||||||||||
Year |
US |
Germany |
Japan |
Euro Area¹ |
||||||||
| Gross external debt | GDP | Ratio External debt / GDP |
Gross external debt | GDP | Ratio External debt / GDP |
Gross external debt | GDP | Ratio External debt / GDP |
Gross external debt | GDP | Ratio External debt / GDP |
|
| (Million current US$) | (Million current US$) | (Million current US$) | (Million current US$) | |||||||||
| 1999 | 9,216,200 | 2,143,618 | 4,368,735 | 6,865,891 | ||||||||
| 2000 | 9,764,800 | 1,900,221 | 4,667,448 | 6,253,078 | ||||||||
| 2001 | 10,075,900 | 2,180,262 | 1,890,971 | 1.15 | 4,095,484 | 6,340,608 | ||||||
| 2002 | 10,417,600 | 2,749,856 | 2,016,921 | 1.36 | 3,918,335 | 6,902,822 | ||||||
| 2003 | 6,946,289 | 10,908,000 | 0.64 | 3,326,742 | 2,442,212 | 1.36 | 1,354,398 | 4,229,097 | 0.32 | 8,527,649 | ||
| 2004 | 8,353,479 | 11,812,300 | 0.71 | 3,775,700 | 2,745,215 | 1.38 | 1,557,069 | 4,605,921 | 0.34 | 9,767,788 | ||
| 2005 | 9,476,403 | 12,579,700 | 0.75 | 3,578,198 | 2,788,390 | 1.28 | 1,521,073 | 4,552,200 | 0.33 | 10,144,011 | ||
| 2006 | 11,204,108 | 13,336,200 | 0.84 | 4,219,206 | 2,916,799 | 1.45 | 1,512,871 | 4,362,590 | 0.35 | 11,436,656 | 10,743,523 | 1.06 |
| 2007 | 13,427,103 | 14,010,800 | 0.96 | 5,117,734 | 3,323,397 | 1.54 | 1,767,807 | 4,377,944 | 0.40 | 14,681,001 | 12,332,044 | 1.19 |
| 2008 | 13,749,570 | 14,369,400 | 0.96 | 5,124,187 | 3,655,912 | 1.40 | 2,230,634 | 4,886,966 | 0.46 | 15,226,996 | 13,565,738 | 1.12 |
| 2009 | 13,767,867 | 14,256,300 | 0.97 | 5,124,906 | 3,346,702 | 1.53 | 2,086,400 | 5,067,526 | 0.41 | 14,965,967 | 12,455,979 | 1.20 |
| 2010-Q1 | 13,917,354 | 4,946,094 | 2,039,850 | 14,569,025 | ||||||||
| 2010-Q2 | 13,984,097 | 4,712,791 | 2,246,005 | 13,720,416 | ||||||||
| Average annual change rate | 7.18% | 3.63% | 4.22% | 4.22% | ||||||||
| ¹ As at January 2011, the Euro Area is an economic and monetary union of the following 17 member states of the European Union: Austria, Belgium, Cyprus, Estonia, Finland, France, Germany, Greece, Ireland, Italy, Luxembourg, Malta, the Netherlands, Portugal, Slovakia, Slovenia, and Spain. | ||||||||||||
Sources: JEDH for external debt, and World DataBank for balance of payments items.