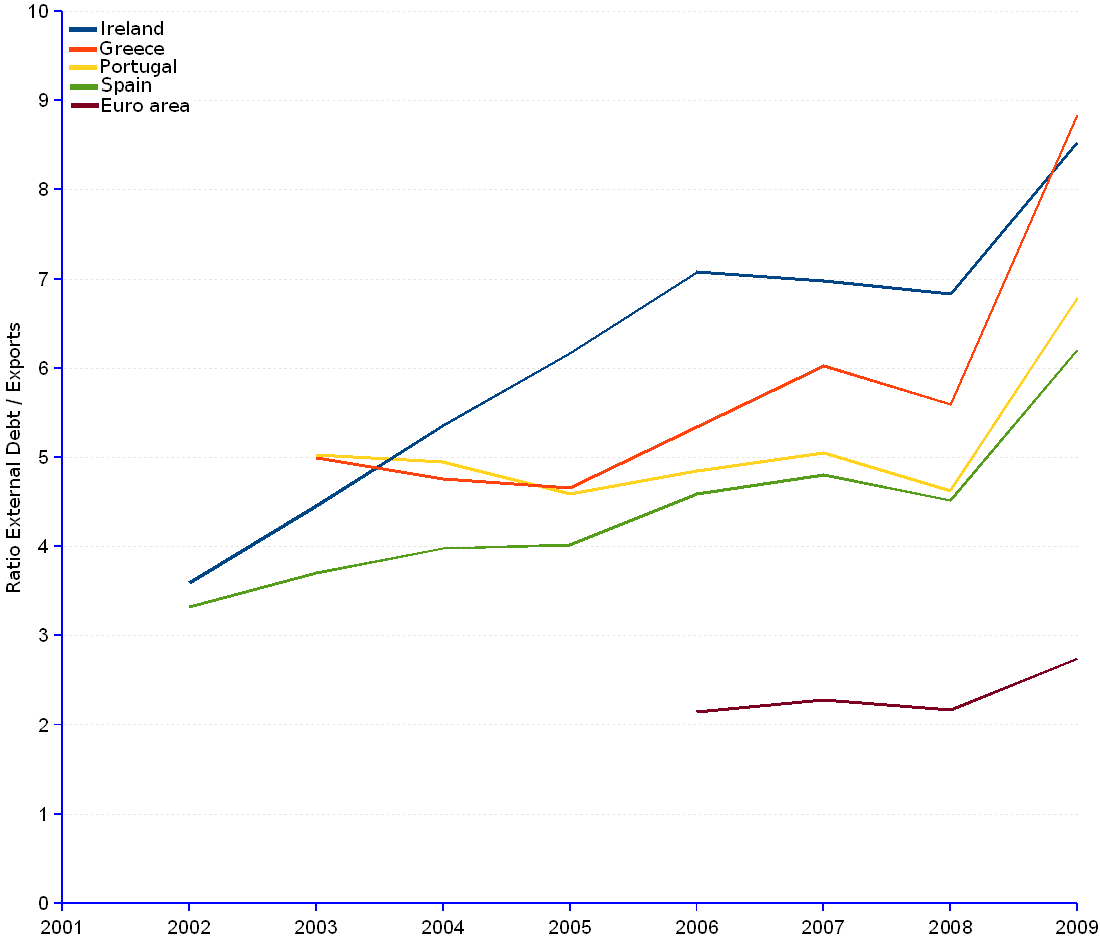

The ratio of gross external debt to exports provides a quick indicator of the capability of an economy to repay external debt with enhanced revenue from sales to foreign countries. A ratio below 1 suggests that debt can be repaid rapidly, theoretically in less than one year. Conversely, the higher the ratio, the lower the country's capability to finance the debt with revenue from exports.
The group of countries formed by Portugal, Ireland, Greece and Spain currently find themselves in a critical position. Not only external debt reaches 6 to 8 times the size of exports, about 3 times higher than the Euro area's average, but it also ran out of control, growing at an alarming annual average rate of 6.2% to 8.2%.
Without decisive remedial action, these countries are at high risk of insolvency. Until recently, they were commonly presented as a showcase of the magic that the European Single Market could operate on the economic laggards. The 2008 crisis dissolved the veneer and brought to light the fundamental weaknesses of an economic development model based on public debt, current account deficit, private consumption, real estate bubbles, financial engineering and outright accounting cosmetics.
PIGS (Portugal, Ireland, Greece, Spain) | ||||||||||||
Year |
Portugal |
Ireland |
Greece |
Spain |
||||||||
| Gross external debt | Exports | Ratio External debt / exports |
Gross external debt | Exports | Ratio External debt / exports |
Gross external debt | Exports | Ratio External debt / exports |
Gross external debt | Exports | Ratio External debt / exports |
|
| (Million current US$) | (Million current US$) | (Million current US$) | (Million current US$) | |||||||||
| 1999 | 41,948 | 107,961 | 29,294 | 183,818 | ||||||||
| 2000 | 41,665 | 119,736 | 33,861 | 190,542 | ||||||||
| 2001 | 42,855 | 129,992 | 33,427 | 197,080 | ||||||||
| 2002 | 43,916 | 508,068 | 141,358 | 3.59 | 32,720 | 708,055 | 212,905 | 3.33 | ||||
| 2003 | 270,454 | 53,827 | 5.02 | 734,333 | 164,780 | 4.46 | 204,577 | 40,954 | 5.00 | 979,794 | 264,285 | 3.71 |
| 2004 | 310,627 | 62,729 | 4.95 | 1,052,149 | 196,316 | 5.36 | 253,287 | 53,214 | 4.76 | 1,235,322 | 310,431 | 3.98 |
| 2005 | 302,220 | 65,885 | 4.59 | 1,336,187 | 216,632 | 6.17 | 262,954 | 56,481 | 4.66 | 1,350,105 | 336,031 | 4.02 |
| 2006 | 381,453 | 78,690 | 4.85 | 1,763,130 | 249,197 | 7.08 | 329,782 | 61,772 | 5.34 | 1,804,654 | 393,454 | 4.59 |
| 2007 | 483,916 | 95,816 | 5.05 | 2,267,387 | 325,081 | 6.97 | 454,200 | 75,396 | 6.02 | 2,301,967 | 479,102 | 4.80 |
| 2008 | 484,710 | 104,766 | 4.63 | 2,355,639 | 344,860 | 6.83 | 504,612 | 90,240 | 5.59 | 2,326,273 | 515,118 | 4.52 |
| 2009 | 548,134 | 80,735 | 6.79 | 2,384,730 | 279,553 | 8.53 | 587,562 | 66,472 | 8.84 | 2,545,095 | 410,186 | 6.20 |
| 2010-Q1 | 537,585 | 2,255,759 | 556,707 | 2,409,824 | ||||||||
| 2010-Q2 | 497,762 | 2,131,267 | 532,934 | 2,165,945 | ||||||||
| Average annual change rate | 5.16% | 13.16% | 9.96% | 9.29% | ||||||||
Sources: JEDH for external debt, and World DataBank for balance of payments items.