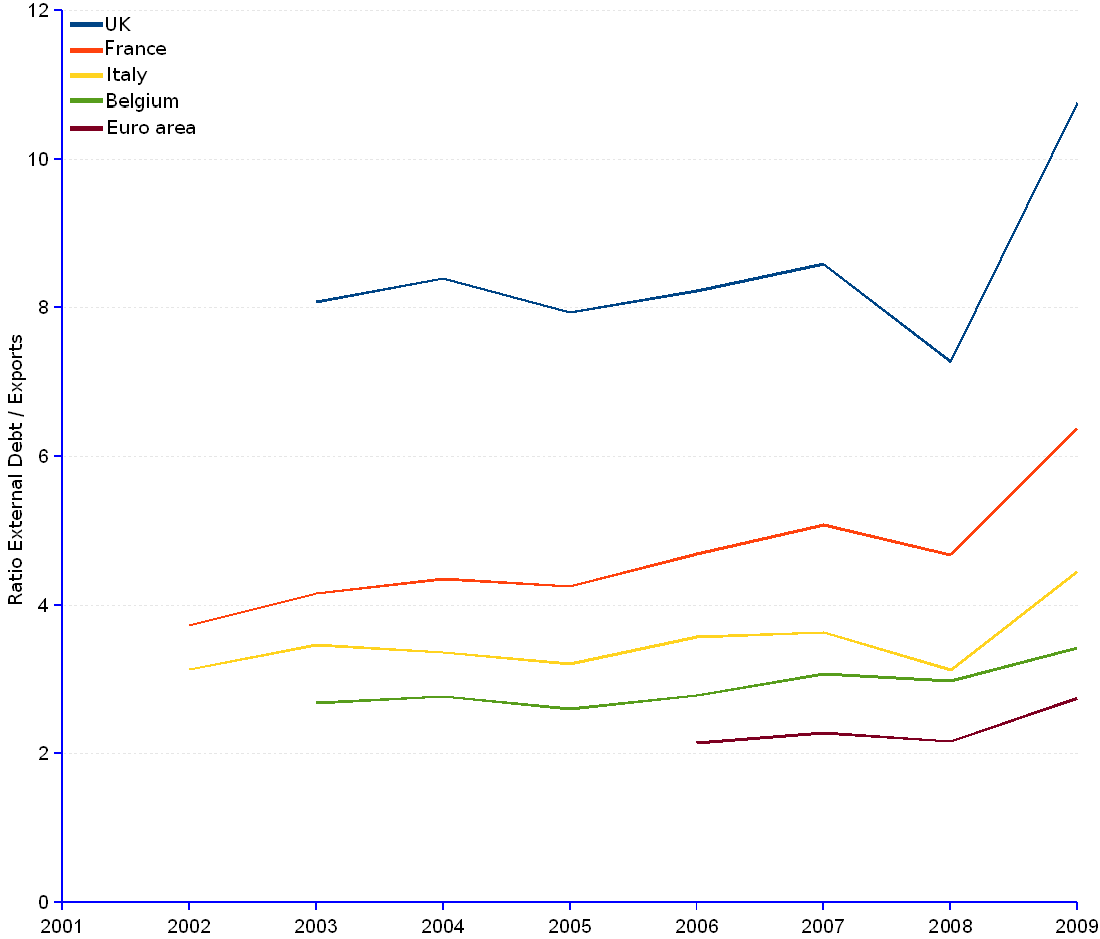

The 2010 debt crisis of Greece immediately followed by Ireland's exposed the diseases of a huge public and private debt coupled with an anemic production apparatus that afflict Europe. The year ended and 2011 started under heavy speculation about the solvency of Portugal and Spain.
However, although most eyes are set on the PIGS, other European areas show worrisome debt-to-exports ratios. In 2009 UK had a ratio of 10.78, higher even than Ireland's or Greece's. France too has a big problem, showing a ratio of 6.38, comparable to that of Portugal or Spain. Italy is not in a much better position with a ratio of 4.46 .
France's external debt has behaved in a peculiar way. After the fashion of Portugal, Greece or Spain, France's foreign debt grew continuously until 2009 and inflected growth only in 2010, two years later than UK and one year later then Belgium. Although deeper analysis would be required, a probable explanation is the strong real-estate related lending (triggered by house price booming) and the state stimulus programs (e.g. tax cuts for high revenues, financial incentives for new car buying). In fact, France's ratio of external debt to GDP for non-financial corporations (around 150% in 2009) and the state (near 100% in 2009) has been higher than Ireland's, UK's or Spain's since 2005.
Political power explains that while much noise is made about the PIGS, relatively little is said about the insolvency risk of UK or France. However, given the weight of these economies, one may wonder about the consequences of such a poor performance for the sustainability of the European Single Market project.
OEA (Other European Areas) | ||||||||||||
Year |
UK |
France |
Italy |
Belgium |
||||||||
| Gross external debt | Exports | Ratio External debt / exports |
Gross external debt | Exports | Ratio External debt / exports |
Gross external debt | Exports | Ratio External debt / exports |
Gross external debt | Exports | Ratio External debt / exports |
|
| (Million current US$) | (Million current US$) | (Million current US$) | (Million current US$) | |||||||||
| 1999 | 553,641 | 454,954 | 341,345 | |||||||||
| 2000 | 606,331 | 454,935 | 336,059 | |||||||||
| 2001 | 594,184 | 453,076 | 341,504 | |||||||||
| 2002 | 599,721 | 1,726,658 | 463,587 | 3.72 | 1,116,957 | 356,657 | 3.13 | 243,399 | ||||
| 2003 | 5,406,413 | 669,523 | 8.08 | 2,300,666 | 553,323 | 4.16 | 1,452,122 | 418,953 | 3.47 | 777,777 | 289,903 | 2.68 |
| 2004 | 6,729,485 | 801,755 | 8.39 | 2,851,561 | 655,917 | 4.35 | 1,647,918 | 490,097 | 3.36 | 961,460 | 347,043 | 2.77 |
| 2005 | 7,385,985 | 930,695 | 7.94 | 3,052,297 | 718,314 | 4.25 | 1,675,759 | 523,205 | 3.2 | 984,755 | 378,248 | 2.60 |
| 2006 | 9,239,287 | 1,122,935 | 8.23 | 3,817,630 | 815,076 | 4.68 | 2,108,044 | 589,720 | 3.57 | 1,155,691 | 414,955 | 2.79 |
| 2007 | 11,260,597 | 1,311,389 | 8.59 | 4,841,930 | 953,232 | 5.08 | 2,549,297 | 702,052 | 3.63 | 1,535,057 | 499,837 | 3.07 |
| 2008 | 9,106,737 | 1,251,783 | 7.28 | 4,862,662 | 1,039,530 | 4.68 | 2,395,317 | 767,125 | 3.12 | 1,595,147 | 535,146 | 2.98 |
| 2009 | 9,337,345 | 867,779 | 10.76 | 5,204,518 | 816,209 | 6.38 | 2,551,151 | 572,335 | 4.46 | 1,436,925 | 420,211 | 3.42 |
| 2010-Q1 | 9,182,070 | 5,127,836 | 2,456,813 | 1,310,850 | ||||||||
| 2010-Q2 | 8,980,793 | 4,698,162 | 2,223,403 | 1,241,221 | ||||||||
| Average annual change rate | 4.89% | 8.01% | 5.19% | 4.15% | ||||||||
Sources: JEDH for external debt, and World DataBank for balance of payments items.