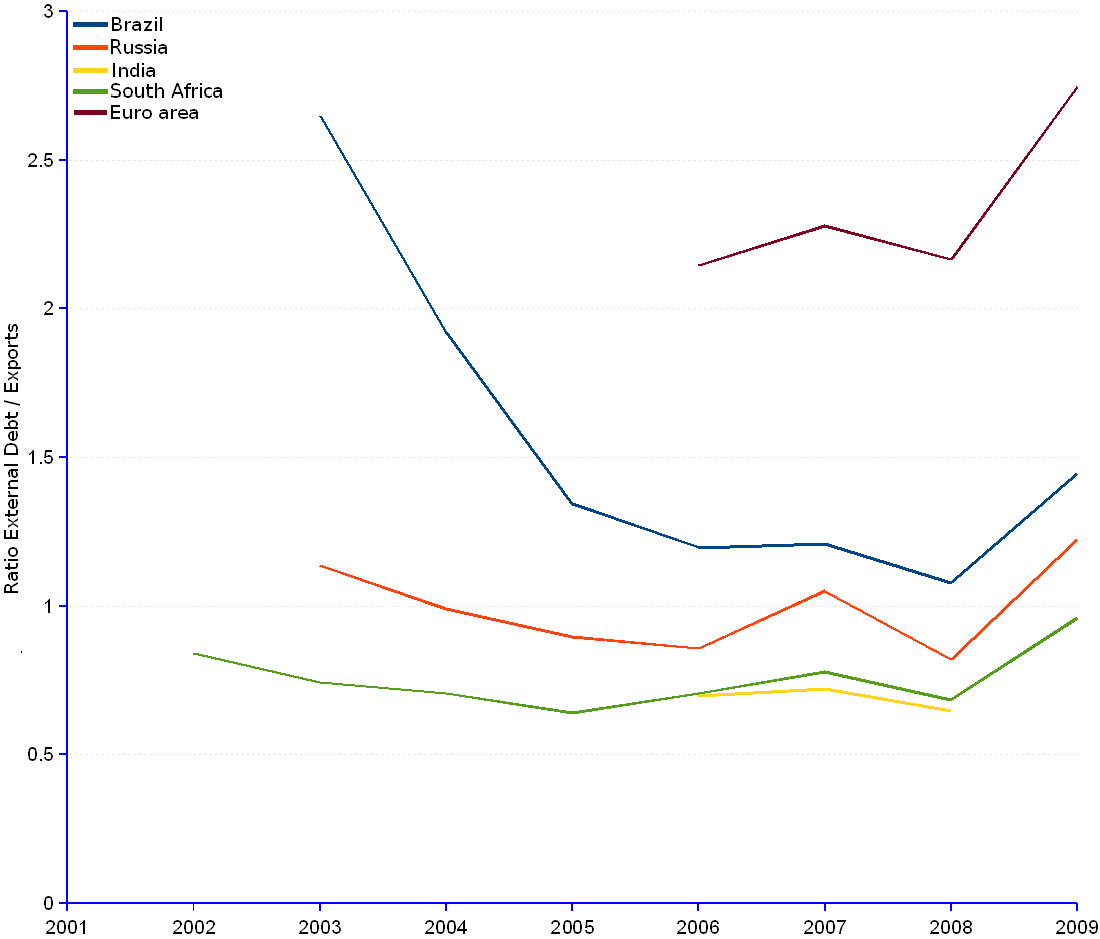

The faster-growing emerging market economies namely Brazil, Russia, India and South Africa are the best in class as the ratio external debt to exports is concerned. They all have ratios below 1.5 and either decreasing significantly, or growing very slowly at an average annual rate below 2% every year.
They put on an outstanding performance, compared with the large economies – as evidenced by the comparison with the Euro area line –, and they push the so-called PIGS group to the abyss. This is revealing of the comparative strengths and weaknesses of the production and export based growth model on one side, and the consumption and credit based model on the other side.
The financial and economic crisis triggered by the latter, which translated in a series of real estate bubble bursts, credit defaults, delinquencies, deep indebtedness, and the subsequent economic squeeze, also affected the BRICS, as evidenced by the sharp fall of exports that induced a rise of the ratio in 2009. Nevertheless, the external debt position of the BRICS is more advantageous than that of other economies, for instance the Euro area, as shown in the chart.
BRICS (Brazil, Russia, India, China¹, South Africa) | ||||||||||||
Year |
Brazil |
Russia |
India |
South Africa |
||||||||
| Gross external debt | Exports | Ratio External debt / exports |
Gross external debt | Exports | Ratio External debt / exports |
Gross external debt | Exports | Ratio External debt / exports |
Gross external debt | Exports | Ratio External debt / exports |
|
| (Million current US$) | (Million current US$) | (Million current US$) | (Million current US$) | |||||||||
| 1999 | 60,326 | 88,499 | 64,308 | 35,535 | ||||||||
| 2000 | 69,317 | 119,350 | 75,191 | 39,507 | ||||||||
| 2001 | 72,003 | 120,488 | 79,798 | 38,389 | ||||||||
| 2002 | 74,919 | 131,218 | 89,436 | 32,728 | 38,936 | 0.84 | ||||||
| 2003 | 235,414 | 88,888 | 2.65 | 185,741 | 163,515 | 1.14 | 109,170 | 37,138 | 49,996 | 0.74 | ||
| 2004 | 220,182 | 114,716 | 1.92 | 214,503 | 216,725 | 0.99 | 139,307 | 43,334 | 61,368 | 0.71 | ||
| 2005 | 187,987 | 140,030 | 1.34 | 257,402 | 286,865 | 0.90 | 182,207 | 46,157 | 72,202 | 0.64 | ||
| 2006 | 199,372 | 166,598 | 1.20 | 313,176 | 365,175 | 0.86 | 160,242 | 229,722 | 0.70 | 59,396 | 84,117 | 0.71 |
| 2007 | 240,495 | 198,905 | 1.21 | 463,915 | 441,906 | 1.05 | 206,005 | 285,698 | 0.72 | 75,275 | 96,620 | 0.78 |
| 2008 | 262,910 | 243,816 | 1.08 | 480,541 | 585,836 | 0.82 | 229,799 | 355,595 | 0.65 | 71,811 | 104,867 | 0.68 |
| 2009 | 277,563 | 191,773 | 1.45 | 467,230 | 381,654 | 1.22 | 252,298 | 79,253 | 82,541 | 0.96 | ||
| 2010-Q1 | 293,005 | 463,754 | 262,252 | 81,729 | ||||||||
| 2010-Q2 | 309,510 | 456,060 | 273,078 | 80,516 | ||||||||
| Average annual change rate | -9.56% | 1.14% | -2.44% | 1.93% | ||||||||
| ¹ The group of nations known by the acronym BRICS includes China. Unfortunately, data for this entity is unavailable. | ||||||||||||
Sources: JEDH for external debt, and World DataBank for balance of payments items.