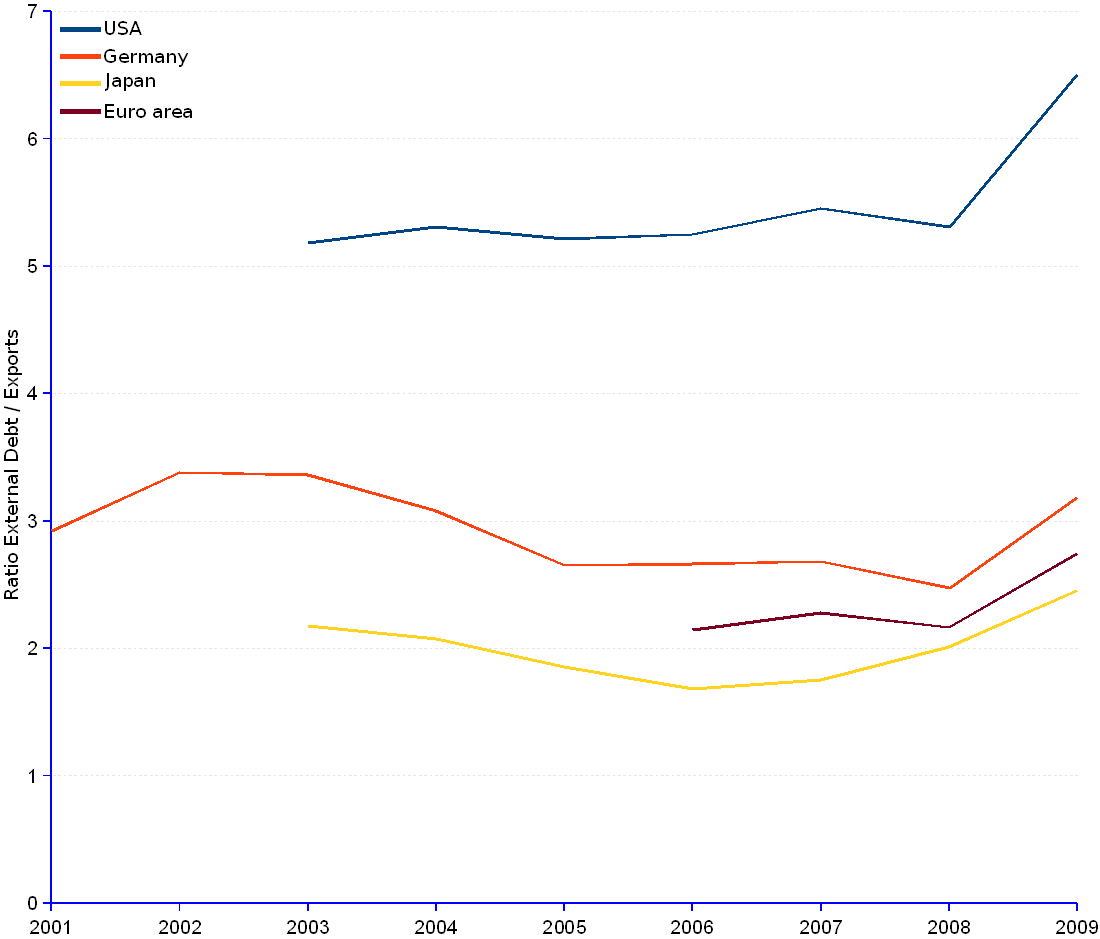

In 2009, large economies had a lukewarm performance, somewhere between the high-performing BRICS and the low-performing PIGS. This diagnosis excludes the USA that, with a ratio of 6.51, seem unable to finance foreign debt with exports. However, the dollar being an international currency, printing money may postpone the problem for a spell – or at least shift the burden to the rest of the world. This is currently the policy adopted by the US, whatever the consequences.
Such a standing may explain that, while the 2008 crisis and the realization of the risk represented by high indebtedness induced Germany, Japan or the Euro area to contain foreign debt and revert the growth trend, albeit modestly and belatedly, the US indulged into a hands-off mood and let foreign debt grow unchecked through the 2nd quarter of 2010.
The modest show of Europe, hampered by the quasi-insolvency of Greece and Ireland, and the dire state of affairs of several other European countries, has already impacted the value of the Euro currency. Between 2009 and 2010 year ends, the Euro lost 8% to the US dollar and 17% to the Swiss Franc.
At the beginning of 2011, the engines of the world economy remain the BRICS and Germany, all economies based on strong production and exports and comparatively low indebtedness.
Selected Large Economies | ||||||||||||
Year |
US |
Germany |
Japan |
Euro Area¹ |
||||||||
| Gross external debt | Exports | Ratio External debt / exports |
Gross external debt | Exports | Ratio External debt / exports |
Gross external debt | Exports | Ratio External debt / exports |
Gross external debt | Exports | Ratio External debt / exports |
|
| (Million current US$) | (Million current US$) | (Million current US$) | (Million current US$) | |||||||||
| 1999 | 1,259,806 | 714,739 | 556,957 | 2,623,242 | ||||||||
| 2000 | 1,421,516 | 734,514 | 626,455 | 2,683,699 | ||||||||
| 2001 | 1,295,695 | 2,180,262 | 745,793 | 2.92 | 552,240 | 2,721,523 | ||||||
| 2002 | 1,258,413 | 2,749,856 | 812,970 | 3.38 | 553,717 | 2,883,305 | ||||||
| 2003 | 6,946,289 | 1,340,648 | 5.18 | 3,326,742 | 989,773 | 3.36 | 1,354,398 | 622,607 | 2.18 | 3,486,084 | ||
| 2004 | 8,353,479 | 1,572,969 | 5.31 | 3,775,700 | 1,225,520 | 3.08 | 1,557,069 | 750,542 | 2.07 | 4,199,795 | ||
| 2005 | 9,476,403 | 1,816,720 | 5.22 | 3,578,198 | 1,349,758 | 2.65 | 1,521,073 | 819,577 | 1.86 | 4,620,025 | ||
| 2006 | 11,204,108 | 2,133,901 | 5.25 | 4,219,206 | 1,582,638 | 2.67 | 1,512,871 | 899,939 | 1.68 | 11,436,656 | 5,329,073 | 2.15 |
| 2007 | 13,427,103 | 2,462,099 | 5.45 | 5,117,734 | 1,907,506 | 2.68 | 1,767,807 | 1,007,928 | 1.75 | 14,681,001 | 6,445,719 | 2.28 |
| 2008 | 13,749,570 | 2,591,235 | 5.31 | 5,124,187 | 2,072,483 | 2.47 | 2,230,634 | 1,108,884 | 2.01 | 15,226,996 | 7,029,484 | 2.17 |
| 2009 | 13,767,867 | 2,115,933 | 6.51 | 5,124,906 | 1,608,120 | 3.19 | 2,086,400 | 850,257 | 2.45 | 14,965,967 | 5,449,628 | 2.75 |
| 2010-Q1 | 13,917,354 | 4,946,094 | 2,039,850 | 14,569,025 | ||||||||
| 2010-Q2 | 13,984,097 | 4,712,791 | 2,246,005 | 13,720,416 | ||||||||
| Average annual change rate | 3.88% | 1.11% | 1.97% | 8.55% | ||||||||
| ¹ As at January 2011, the Euro Area is an economic and monetary union of the following 17 member states of the European Union: Austria, Belgium, Cyprus, Estonia, Finland, France, Germany, Greece, Ireland, Italy, Luxembourg, Malta, the Netherlands, Portugal, Slovakia, Slovenia, and Spain. | ||||||||||||
Sources: JEDH for external debt, and World DataBank for balance of payments items.