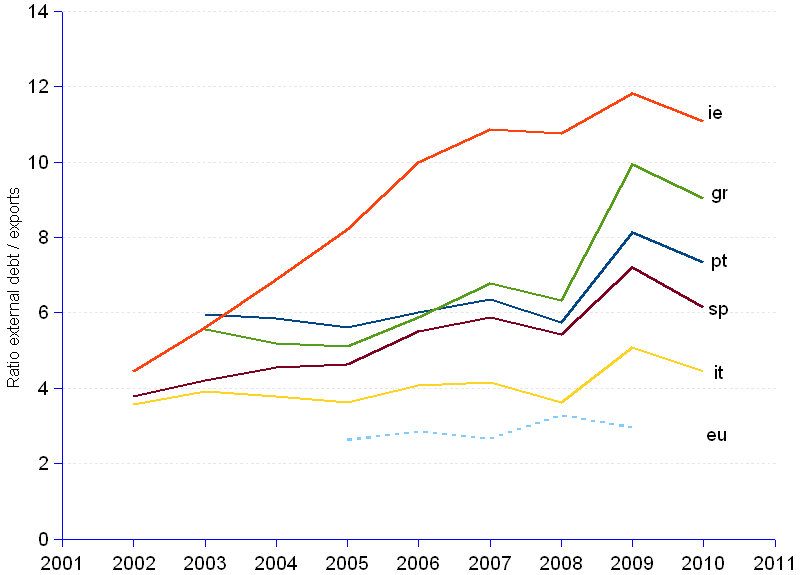
The relationship between growth and external debt is widely acknowledged. The World Bank has set two external debt thresholds : a debt to GDP ratio of 80%, and a debt to exports ratio of 220%. Above these critical values, the risk of a debt crisis will have the heaviest negative impact on growth.
All PIIGS, and the whole of the Euro zone for that matter, exhibit debt to GDP ratios above , in some instances far above, the World Bank benchmark. As regards exports, their situation is even worse : debt to exports ratios vary between 4.5 (or twice the World Bank benchmark) for Italy, and 11.1 (or 5 times) for Ireland. Should World Bank research be true, all PIIGS — and the Euro zone to a less extent — are right in the middle of the storm.
The chart shows an increasing debt to exports ratio over time, growing at annual average rates of 3% in Italy, 4% in Portugal, 6% in Spain, 7% in Greece, and 12% in Ireland. Although the global financial crisis — with the ensuing credit and liquidity crunches, and the economic slump — slowed the indebtedness process down, the situation did not improve, since ratios remain extremely high on one hand, and on the other hand exports have significantly shrank, at annual rates of -8% in Portugal, -3% in Ireland, -10% in Italy, -14% in Greece and -7% in Spain, since 2008. The last 5-year current account balance performance of PIIGS, revealing deficits that vary from 4% to 10% of GDP, does not suggest that they are ready to become big net exporters. Considering the prevailing economic stagnation in Europe and in the world, it is doubtful that PIIGS countries will be able to revert the trend and push up exports to the proportion of their needs.
Furthermore, for open economies such as PIIGS that use external borrowing for productive investment, interest rates have great impact on the outlook of their indebtedness. Currently, the interest rates and the spreads imposed on them by the market are invariably high with a tendency to rise, thus increasing the debt service burden, and deteriorating the exports to debt ratio. Prevailing high debt to export ratios, slumbering exports and high long-term interests, all three factors combine to make total debt to grow faster than the economy’s basic source of external income, thus sending a clear signal that the country will face problems meeting its debt obligations in the future. Such an anticipation cannot fail to stimulate defensive reactions on the creditors side, namely credit freezing and interest raising, which in turn reinforce further economic slowdown and increasing debt in the concerned countries.
Ratio Gross External Debt over Exports | ||||||||||||||||||
Year¹ |
Portugal |
Ireland |
Italy |
Greece |
Spain |
Euro area |
||||||||||||
| Gross external debt ² | Exports ² | External debt/ |
Gross external debt ² | Exports ² | External debt/ |
Gross external debt ² | Exports ² | External debt/ |
Gross external debt ² | Exports ² | External debt/ |
Gross external debt ² | Exports ² | External debt/ |
Gross external debt ² | Exports ² | External debt/ |
|
| 2002 | 40 | 552 | 124 | 4.5 | 1,213 | 340 | 3.6 | 33 | 769 | 203 | 3.8 | 2,728 | ||||||
| 2003 | 287 | 48 | 5.9 | 780 | 139 | 5.6 | 1,543 | 393 | 3.9 | 217 | 39 | 5.6 | 1,041 | 247 | 4.2 | 3,198 | ||
| 2004 | 321 | 55 | 5.8 | 1,087 | 158 | 6.9 | 1,703 | 451 | 3.8 | 262 | 50 | 5.2 | 1,277 | 280 | 4.6 | 3,703 | ||
| 2005 | 302 | 54 | 5.6 | 1,336 | 163 | 8.2 | 1,676 | 462 | 3.6 | 263 | 52 | 5.1 | 1,350 | 291 | 4.6 | 3,861 | ||
| 2006 | 369 | 61 | 6.0 | 1,708 | 171 | 10.0 | 2,042 | 501 | 4.1 | 319 | 54 | 5.9 | 1,748 | 317 | 5.5 | 11,081 | 4,210 | 2.6 |
| 2007 | 455 | 72 | 6.4 | 2,133 | 196 | 10.9 | 2,398 | 577 | 4.2 | 427 | 63 | 6.8 | 2,166 | 369 | 5.9 | 13,837 | 4,848 | 2.9 |
| 2008 | 446 | 77 | 5.8 | 2,169 | 202 | 10.8 | 2,205 | 609 | 3.6 | 465 | 73 | 6.3 | 2,142 | 395 | 5.4 | 13,984 | 5,261 | 2.7 |
| 2009 | 501 | 62 | 8.1 | 2,176 | 184 | 11.8 | 2,327 | 458 | 5.1 | 536 | 54 | 9.9 | 2,309 | 321 | 7.2 | 13,657 | 4,153 | 3.3 |
| 2010 | 478 | 65 | 7.3 | 2,082 | 188 | 11.1 | 2,201 | 494 | 4.5 | 491 | 54 | 9.0 | 2,087 | 340 | 6.1 | 13,303 | 4,487 | 3.0 |
| 2011 | 461 | 2,031 | 2,244 | 492 | 2,153 | 14,003 | ||||||||||||
| Avge annual growth rate | 6.1% | 34.9% | 3.8% | 15.6% | 5.3% | 12.1% | 7.1% | 4.8% | 2.8% | 10.7% | 6.6% | 7.2% | 12.1% | 6.6% | 6.2% | 4.8% | 6.4% | 3.0% |
| Exports change rate 2008-2010 | -8% | -3% | -10% | -14% | -7% | -8% | ||||||||||||
| ¹ All years show 4th Quarter values, except 2011 that is 3rd Quarter. | ||||||||||||||||||
| ² Billion real US$, 2005=100. | ||||||||||||||||||
Sources: JEDH for external debt, and World DataBank for exports estimates.