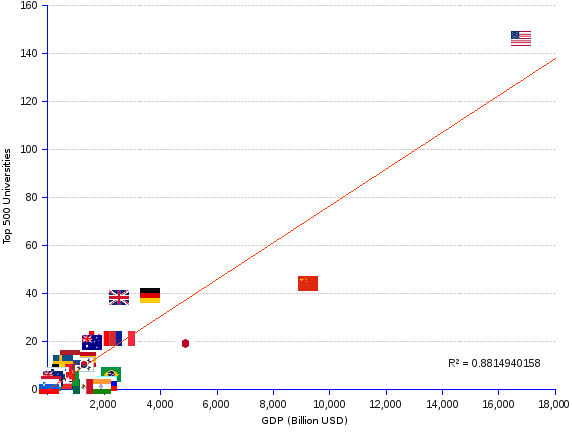
Top ranked universities are strongly correlated (r = 0.94, R² = 0.88) with the weight of the national economy, as measured by the Gross Domestic Product (GDP). The higher the GDP, the more a nation has Universities ranked amongst the top 500 worldwide. The linear correlation line (in red) shows that, while some nations are ahead (e.g. USA, UK, Germany, Australia) or behind the trend (e.g. China, Japan, Brazil, India), they all reveal the relationship between university riches and economic muscle. The question remains: do nations have fine universities because they are wealthy, or are they wealthy because they have fine universities?
Number of 500 top-ranked Universities | ||
Nation | Number | GDP ¹ |
| Argentina | 1 | 611,755 |
| Australia | 19 | 1,560,597 |
| Austria | 6 | 415,844 |
| Belgium | 7 | 508,116 |
| Brazil | 6 | 2,245,673 |
| Canada | 21 | 1,825,096 |
| Chile | 2 | 277,199 |
| China | 44 | 9,240,270 |
| Czech | 1 | 198,450 |
| Denmark | 5 | 330,814 |
| Egypt | 1 | 271,973 |
| Finland | 5 | 256,842 |
| France | 21 | 2,734,949 |
| Germany | 39 | 3,634,823 |
| Greece | 2 | 241,721 |
| Hungary | 2 | 124,600 |
| India | 1 | 1,876,797 |
| Iran | 1 | 368,904 |
| Ireland | 3 | 217,816 |
| Israel | 6 | 291,357 |
| Italy | 21 | 2,071,307 |
| Japan | 19 | 4,901,530 |
| Malaysia | 2 | 312,435 |
| Mexico | 1 | 1,260,915 |
| Netherlands | 13 | 800,173 |
| New Zealand | 4 | 182,594 |
| Norway | 3 | 512,580 |
| Poland | 2 | 517,543 |
| Portugal | 3 | 219,962 |
| Russia | 2 | 2,096,777 |
| Saudi Arabia | 4 | 745,273 |
| Serbia | 1 | 42,521 |
| Singapore | 2 | 297,941 |
| Slovenia | 1 | 45,378 |
| South Africa | 4 | 350,630 |
| South Korea | 10 | 1,304,554 |
| Spain | 12 | 1,358,263 |
| Sweden | 11 | 557,938 |
| Switzerland | 7 | 650,782 |
| Turkey | 1 | 820,207 |
| United Kingdom | 38 | 2,522,261 |
| United States | 146 | 16,800,000 |
| Total | 500 | |
| Correlation coefficient r | 0.94 | |
| Determination coefficient R² | 0.88 | |
| ¹ GDP 2013. | ||
Sources: Institute of Higher Education, Shanghai, and World Development Indicators database by World Bank.