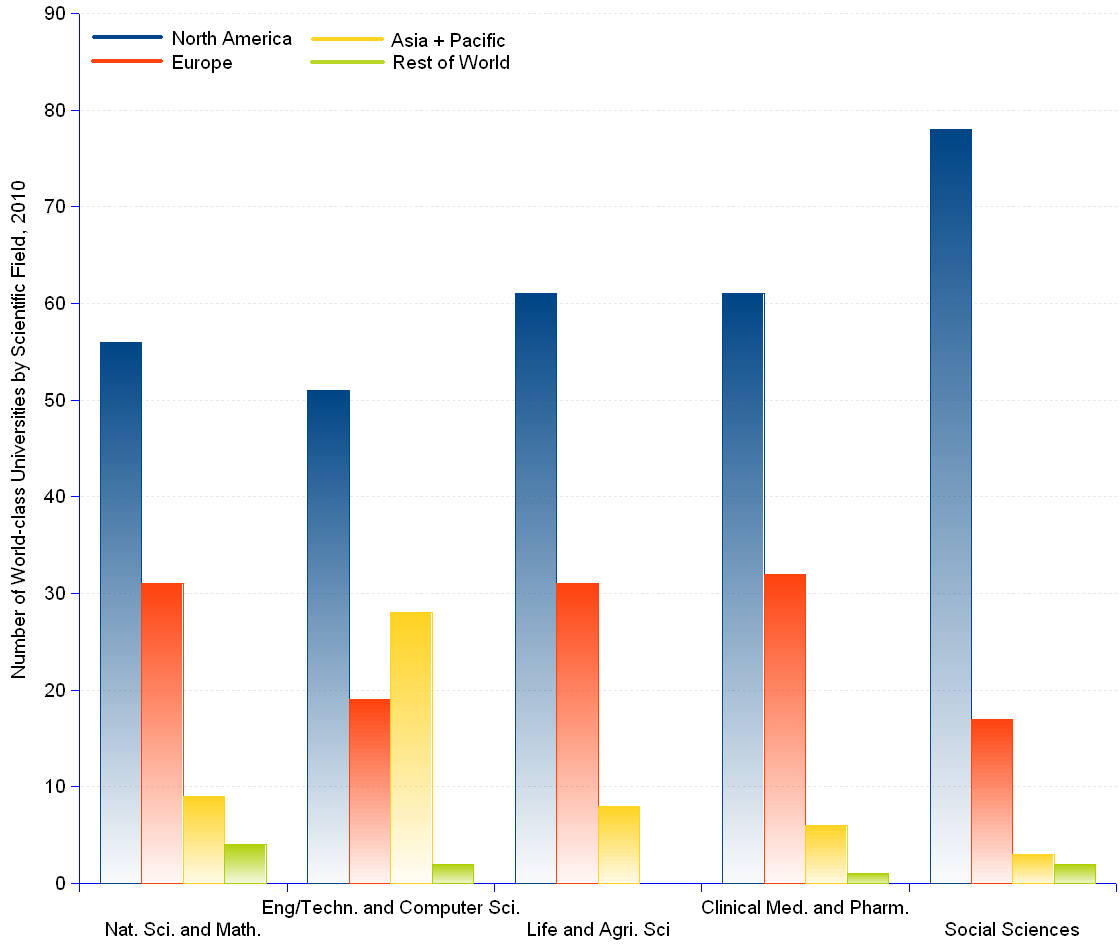
The 2010 distribution of the 100 best universities by region confirms the common intuition that the field of Engineering and Computer Sciences matters a lot for the Asia-Pacific countries. For the manufacturing and export-oriented China, Japan, Korea or India, engineering is definitely the field in focus, while this area comes last for North America, where the number one field of interest is Social Sciences.
Considering the values in relative terms (in absolute terms North America dominates across the board), one feels tempted to interpret the chart as a quick sketch of the world situation. On one side, North America, mainly the United States, losing interest in the engineering operations, after having discovered that social sciences – economics and other "dismal sciences" – are an excellent proxy to rule the world. Then, the Asian countries waking up to the opportunity opened by the western industrial surrender, and placing their bets on the hard-core technologies. As regards Europe, maybe dazzled by the American aura, it seems content with being a good follower — eventually finding itself stuck in the middle.
100 World-Class Universities by Scientific Field and by Region | |||||||||
Scientific Field | North America | Europe | Asia & Pacific | Rest of the World | Total | ||||
| Number | Percent | Number | Percent | Number | Percent | Number | Percent | ||
| Natural Sciences and Mathematics | 56 | 56% | 31 | 31% | 9 | 9% | 4 | 4% | 100 |
| Engineering/Technology and Computer Sciences | 51 | 51% | 19 | 19% | 28 | 28% | 2 | 2% | 100 |
| Life and Agriculture Sciences | 61 | 61% | 31 | 31% | 8 | 8% | 0 | 0% | 100 |
| Clinical Medicine and Pharmacy | 61 | 61% | 32 | 32% | 6 | 6% | 1 | 1% | 100 |
| Social Sciences | 78 | 78% | 17 | 17% | 3 | 3% | 2 | 2% | 100 |
| Total | 307 | 61% | 130 | 26% | 54 | 11% | 9 | 2% | 500 |
Sources: see Institute of Higher Education, Shanghai.