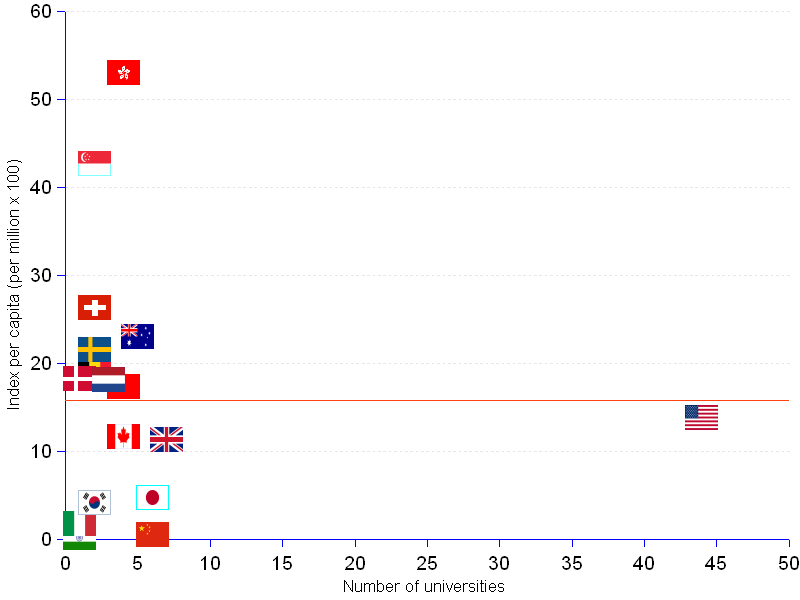

The United States gets 44 slots in the academic ranking of the top 100 world universities in engineering, technology and computer sciences in 2012. China, however, after consolidation of Taiwan and Hong Kong, can boast a formidable presence, with 14% of the slots. The Europeans give a modest show individually, although if we consider them as a whole — the European Union — they can claim the 2nd rank with 19 universities in the list, 1 less than in 2011.
The high-performers in per capita terms are Hong Kong and Singapore, well above the average, with a presence commensurate to their reputation for being the world hubs of information technology. Israel and Switzerland put on a fine act too, with indexes well above the average and the median values.
The United Sates have been losing ground : they used to place 47 of their schools in the top 100 in 2010, 46 in 2011 and 44 this current year. Their per capita index is clearly below average (red line) and below the median index. The strong presence of the regional group formed of Taiwan, South Korea, Japan, India and China in the top 100 list provides evidence of the growing role of Southeast Asian countries in the technology realm at the expenses of the Western nations.
World top 100 universities in engineering, technonoloy and computer science | |||
Country | Number | Population | Per capita |
| Million | (Nbr/Millionx100) | ||
| Australia | 5 | 21.8 | 23.0 |
| Belgium | 2 | 10.6 | 18.9 |
| Canada | 4 | 34.3 | 11.7 |
| China | 6 | 1,366.6 | 0.4 |
| China, Hong Kong | 4 | 7.6 | 53.0 |
| China, Taiwan | 4 | 23.1 | 17.3 |
| Denmark | 1 | 5.5 | 18.2 |
| France | 1 | 63.0 | 1.6 |
| Germany | 1 | 82.2 | 1.2 |
| India | 1 | 1,253.6 | 0.1 |
| Israel | 2 | 7.5 | 26.7 |
| Italy | 1 | 59.1 | 1.7 |
| Japan | 6 | 127.4 | 4.7 |
| Korea, Rep. of | 2 | 48.9 | 4.1 |
| Netherlands | 3 | 16.6 | 18.1 |
| Singapore | 2 | 4.7 | 42.7 |
| Sweden | 2 | 9.3 | 21.5 |
| Switzerland | 2 | 7.6 | 26.2 |
| United Kingdom | 7 | 62.0 | 11.3 |
| United States | 44 | 320.5 | 13.7 |
| Median | 2 | 15.5 | |
| Average | 5 | 15.8 | |
| ¹ Browse the complete List of 200 best engineering universities. | |||
Sources: Institute of Higher Education, Shanghai, UN Population Division, and CIA - The World Factbook.