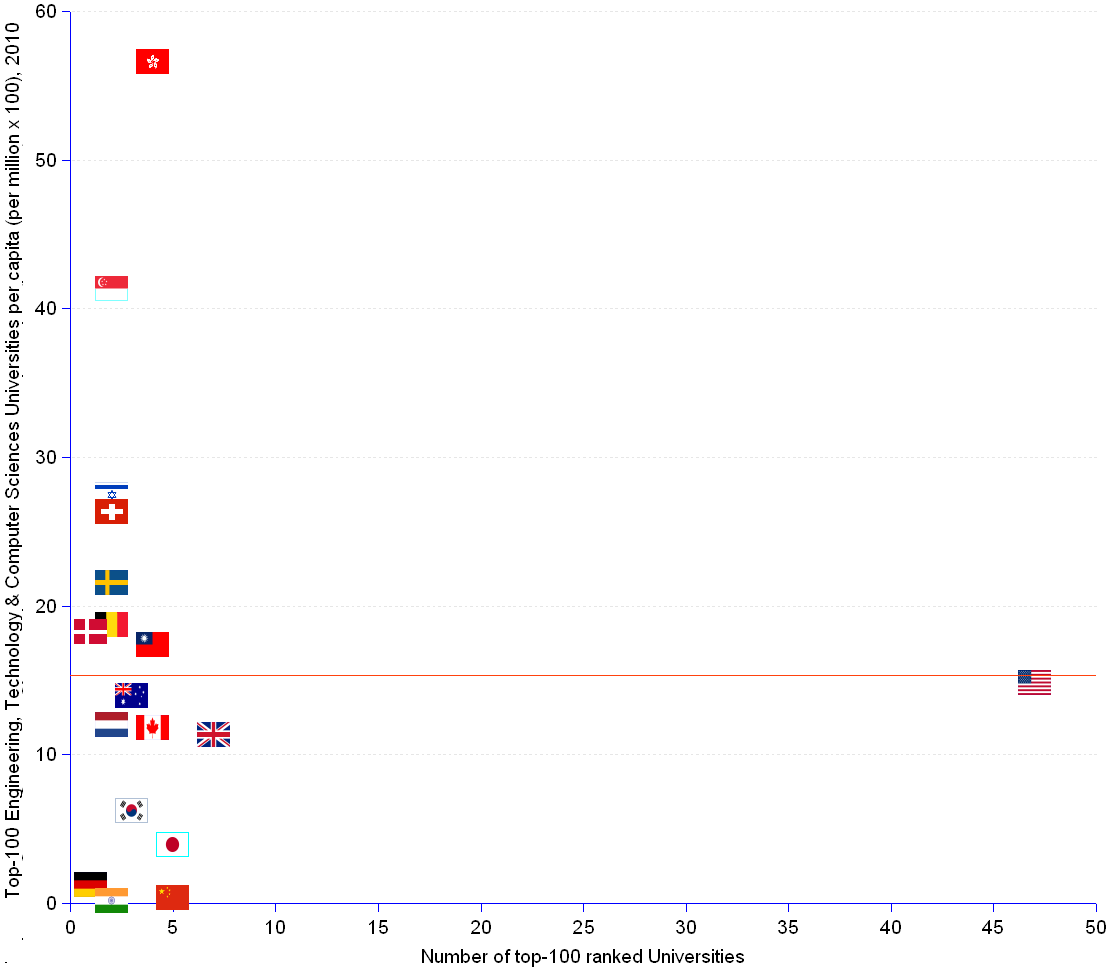
Hong Kong and Singapore show a per capita performance in line with their reputation for being the world hubs of information technology. Israel and Switzerland put on a fine act too, with indexes more than twice the median value of 12.98. Although the USA place 47 of their schools in the top 100 list, they are just average (red line) and little above the median index. The presence of Taiwan, South Korea, Japan, India and China in the top 100 list provides evidence of the growing role of Asian countries in the technology realm.
100 Top Universities per Capita | |||
Country | Number | Population | Per capita |
| Million | (Nbr/Millionx100) | ||
| Australia | 3 | 21.51 | 13.95 |
| Belgium | 2 | 10.70 | 18.70 |
| Canada | 4 | 33.89 | 11.80 |
| China | 5 | 1,354.15 | 0.37 |
| Denmark | 1 | 5.48 | 18.24 |
| France | 1 | 62.64 | 1.60 |
| Germany | 1 | 82.06 | 1.22 |
| Hong Kong | 4 | 7.07 | 56.58 |
| India | 2 | 1,214.46 | 0.16 |
| Israel | 2 | 7.29 | 27.45 |
| Italy | 1 | 60.10 | 1.66 |
| Japan | 5 | 127.00 | 3.94 |
| Netherlands | 2 | 16.65 | 12.01 |
| Singapore | 2 | 4.84 | 41.35 |
| South Korea | 3 | 48.50 | 6.19 |
| Sweden | 2 | 9.29 | 21.52 |
| Switzerland | 2 | 7.59 | 26.33 |
| Taiwan | 4 | 23.02 | 17.37 |
| United Kingdom | 7 | 61.90 | 11.31 |
| United States | 47 | 317.64 | 14.80 |
| Median | 2 | 12.98 | |
Sources: see Institute of Higher Education, Shanghai and UN Population Division