areppim: information, pure and simple
areppim: information, pure and simple


You are here:   areppim >  Economy: Trade, Imports & Exports

Portugal's international trade sinking in the Covid19 quicksands


PPortugal's five main export categories fall by 40 percent

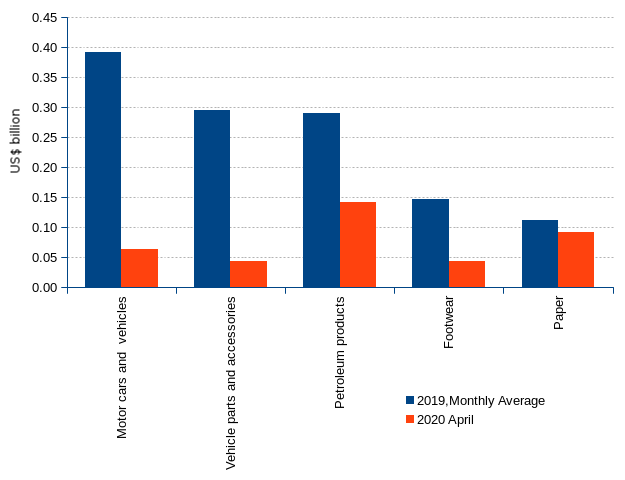
The Covid19 pandemic toppled Portugal’s international trade down. The United Nations Comtrade reports that the five most important merchandise export categories, namely motor cars and vehicles, vehicle parts and accessories, footwear, paper and tires in descending order, suffered heavy falls in value after the pandemic has been declared. Comparing the month of April to the monthly average of 2019, total exports declined by -41 percent. Exports of cars and of accessories dropped by about -85 percent each, and footwear by -70 percent. The monthly breakdown of exports in Euro currency provided by the Portuguese INE (Instituto Nacional de Estatísticas), with a merchandise classification different from the UN Comtrade one, confirms the fall of exports in March 2020 (-12.66 percent), followed by the debacle (-39.75 percent) in April 2020.

The country’s trade profile deserves some attention. Considering the top five exports and the top five imports, an almost one-to-one relationship becomes apparent. Exception made of footwear, which is largely a genuine Portuguese designed and built product, Portugal is just a link of the international manufacturing merry-go-round. The country imports oil, puts it through its highly pollutant oil refineries and exports petroleum products. It imports engines, gearboxes, chassis, automobile electronic systems, etc., assembles them in the large auto makers-owned assembly lines installed in the country, then exports cars, parts and accessories. The same with railway material. It produces pulp in the polluting mills that the big international paper makers once preferred to relocate, then it exports plain paper products.

The contribution of exports and imports to Portugal’s GDP being very weighty, a weakening foreign demand immediately blows a chill across the Portuguese economy. The INE/BoP overview shows that, as the world grew more nervous about the potential consequences of the coronavirus spread, and industrial and private consumers put the brakes on purchasing, exports had an immediate setback (-4.89 percent, Q1 2020), followed by the decline of imports (-1.99 percent). Against the backdrop of the Covid19, it would not be sensible to continue buying parts for the idling assembly lines, or to purchase more crude oil to refine into kerosene, diesel or benzine for grounded aircrafts or for cars standing still in the parking lots. The combined contraction of exports and imports, together with the general slowdown of the economy caused a contraction of the GDP by -2.32 percent.

By and large, Portugal's remains an ancillary economy, subordinated to the wealthier countries, doing the menial or the dirty jobs, performing the low value-added tasks. Assembling cars and vehicles is well below the designing and building of engines, gearboxes, or automotive electronic systems, both in terms of ingenuity and uniqueness. Making beds, cleaning rooms or serving at tables for tourists, in other words housekeeping, be it for residents or for tourists, is quite a useful deed, but surely not the pinnacle of one’s accomplishments. Oil refineries and pulp mills may provide much needed immediate returns, but they have hidden and deferred costs, such as those incurred by the health hazards and environmental damages caused by their polluting operations, costs that the wealthier countries deem exorbitant and endeavor to get rid thereof. The bottom line is that an ancillary economy is a low rewarding, precarious, vulnerable and ultimately a costly one. It may be a necessary development stage before ascending to a balanced, viable and congruous economy, but not a state to be content with. The shame is that both Portuguese politicians and entrepreneurs feel cozy with it, and do not strive to try and open new paths leading to a more consistent economy.


Key exports fizzled

Go to top Portugal's Five Main Exports and Imports, 2019, April 2020

Portugal’s five main exports

Portugal’s five main imports

 Product
Classification
20192020 AprilChange Product
Classification
20192020 AprilChange
US$ billion% ExportsMonthly averageUS$ billion%US$ billion% ImportsMonthly averageUS$ billion%
Total Exports 67 5.583.27-41.43%Total Imports 89.9 7.494.49-40.07%
Motor cars and  vehicles87034.717.03%0.390.063-83.95%Oil27095.446.05%0.450.252-44.41%
Vehicle parts and accessories87083.555.30%0.30.044-85.13%Motor cars and  vehicles87035.420.20%0.450.139-69.23%
Petroleum products27103.495.21%0.290.142-51.17%Vehicle parts and accessories87083.640.04%0.30.084-72.31%
Footwear64031.762.63%0.150.044-70.00%Aircraft88023.040.03%0.25 -100.00%
Paper48021.342.00%0.110.092-17.61%Medicaments30042.190.02%0.180.20110.14%
Tyres40111.081.61%0.09 -100.00%Petroleum products27102.060.07%0.170.042-75.53%
Source: United Nations Comtrade, https://trendeconomy.com/


Go to top Portugal's Exports breakdown, 2019, April 2020

20192020Change
 Food and beveragesIndustrial supplies not elsewhere specifiedFuels and lubricantsCapital goods, and parts and accessories thereof *Transport equipment and parts and accessories thereofConsumer goods not elsewhere specifiedGoods not elsewhere specifiedTotal Food and beveragesIndustrial supplies not elsewhere specifiedFuels and lubricantsCapital goods, and parts and accessories thereofTransport equipment and parts and accessories thereofConsumer goods not elsewhere specifiedGoods not elsewhere specifiedTotal
BEC¹1234567BEC¹1234567
January483.11,597.9277.2635.71,048.3927.72.14,972.2January508.61,543.6413.1720.81,030.2933.22.75,152.13.62%
February474.91,564.6208.1669.91,024.4922.42.24,866.6February473.71,462.7297.8704.91,039.1900.73.54,882.60.33%
March511.81,701.4246.3695.51,092.2931.92.65,181.6March540.61,589.7232.5637.3709.0809.27.44,525.6-12.66%
April481.01,646.7318.6627.31,069.9841.72.54,987.6April482.31,191.4147.1411.2239.2528.55.23,004.9-39.75%
May527.21,782.4407.4745.61,176.6960.33.45,602.9May         
June481.01,530.7251.6650.4938.8888.73.54,744.8June         
July537.71,742.7298.0724.4952.21,130.04.15,389.0July         
August434.61,219.2218.0569.4574.2804.52.63,822.5August         
September546.51,499.0221.0669.81,131.2860.02.84,930.3September         
October638.21,720.0248.5813.11,128.81,030.63.75,583.0October         
November600.41,443.5352.1790.31,090.4940.53.35,220.6November         
December511.11,282.7446.2674.2838.8836.83.64,593.5December         
Total6,227.518,730.73,493.18,265.512,065.911,075.236.659,894.5Total2,005.25,787.41,090.52,474.13,017.53,171.718.817,565.2-12.21%
% of total exports10.40%31.27%5.83%13.80%20.15%18.49%0.06%100.00%% of total exports11.42%32.95%6.21%3.52%4.29%4.51%0.03%100.00% 
% of GDP3.08%9.25%1.73%4.08%5.96%5.47%0.02%29.59%% of GDP²3.10%9.36%1.92%4.20%5.66%5.38%0.03%29.66% 
Monthly average519.01,560.9291.1688.81,005.5922.93.04,991.2Monthly average501.31,446.9272.6618.5754.4792.94.74,391.3-12.02%
Total JFMA-191,950.86,510.61,050.22,628.34,234.83,623.79.420,008.0Change JFMA-20/192.79%-11.11%3.83%-5.87%-28.75%-12.47%99.45%-12.21% 
¹ BEC - classification by Broad Economic Categories.
² Total exports and GDP for Q1.
Source: INE Instituto Nacional de Estatísticas.


Go to top Exports, imports, GDP aggregates

 2019% of GDP2020Change
Q1 20
on
Q1 19
IIIIIIIVYearI
GDP50,25850,50550,63651,009202,408 49,090-2.32%
Exports21,97922,03721,60522,49688,11743.53%20,905-4.89%
Imports21,83821,80621,92922,07887,65143.30%21,402-1.99%
Sources: INE Instituto Nacional de Estatísticas, and Bank of Portugal.