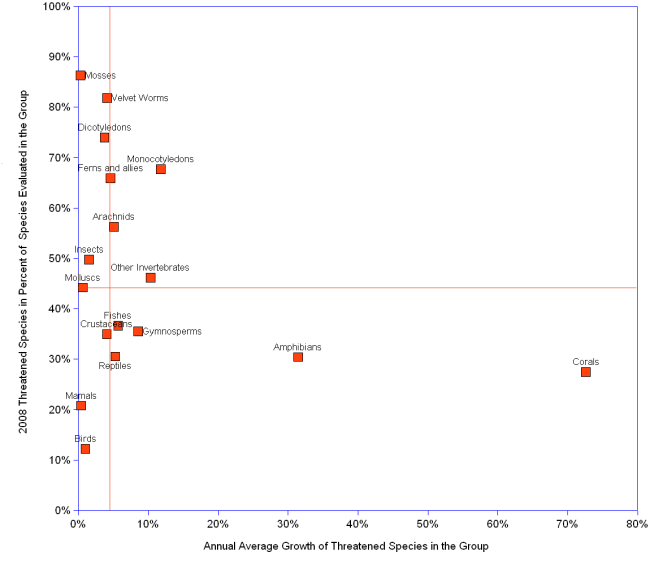

In 2008, threatened species represent between 12% and 86% (median 44.2%, horizontal orange line) of the total populations of their groups. The average annual growth rate of the number of threatened species varies from 1% to 73% (median 4.6% for the displayed set, vertical orange line).
Threatened Species in Their Groups of Organisms | |||
Group of Species |
Average Annual Growth of Threatened Species |
Threatened Species as Percent of Evaluated Species |
Evaluated Species as Percent of Described Species ¹ |
| Corals | 73% | 27% | 39.36% |
| Amphibians | 31% | 30% | 98.63% |
| Monocotyledons * | 12% | 68% | 1.95% |
| Other Invertebrates | 10% | 46% | 0.09% |
| Gymnosperms ** | 9% | 35% | 92.86% |
| Fishes | 6% | 37% | 11.34% |
| Reptiles | 5% | 31% | 15.86% |
| Arachnids | 5% | 56% | 0.03% |
| Ferns and allies | 5% | 66% | 1.64% |
| Velvet Worms | 4% | 82% | 6.67% |
| Crustaceans | 4% | 35% | 4.34% |
| Dicotyledons *** | 4% | 74% | 4.83% |
| Insects | 2% | 50% | 0.13% |
| Birds | 1% | 12% | 100.00% |
| Molluscs | 1% | 44% | 2.73% |
| Mamals | 0.4% | 21% | 100.00% |
| Mosses | 0.3% | 86% | 0.59% |
| ¹ Only mammals, birds, amphibians and gymnosperms are completely or almost completely evaluated. In the other cases, only a fraction of the known species has been evaluated, hence a probable bias inflating the number of threatened species in the group. The number of evaluated as percent of the described species is provided to allow for a cautious interpretation. | |||
| * Monocotyledons: family of plants that includes grains (maize, rice, wheat, barley,etc.), pasture grasses, sugar cane, banana, and vegetables such as onions and garlic. | |||
| ** Conifers are the most abundant gymnosperms. Construction timber and paper pulp are supplied by gymnosperms. | |||
| *** Dicotyledons: group of flower plants that includes such staple food items as beans, soybeans, lentils, peas. | |||
Sources: see IUCN