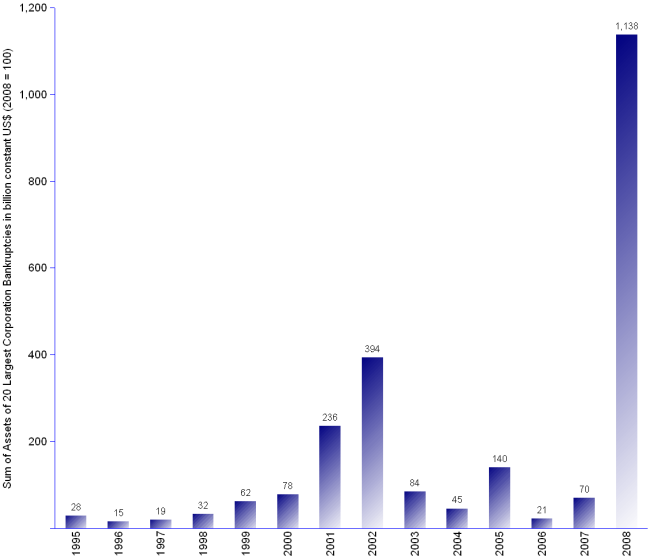

The value of the assets destroyed by the 20 largest company failures could be a pointer to the economy setbacks. The total for 2008 represents about 89% of the sum of the GDP (gross domestic product) of Finland, Norway and Sweden taken together.
The 2000-2002 peaks follow the burst of the Internet bubble, and the 11 September Twin Towers attack.
The 2005 peak coincides with the catastrophic consequences of the late 2004 Asian tsunamis and the devastating hurricanes Katrina and Rita.
The out-of-scale 2008 peak betrays the appalling meltdown of the world economy following the subprime financial crisis.
Total value destroyed by the 20 top bankruptcies, 1995-2008 | ||
Year |
Sum of pre-petition assets of top 20 public company bankruptcies |
|
| million current US$ | million constant US$ (2008=100) | |
| 1995 | 21,388 | 28,365 |
| 1996 | 11,569 | 15,057 |
| 1997 | 15,184 | 19,439 |
| 1998 | 25,573 | 32,380 |
| 1999 | 49,877 | 62,253 |
| 2000 | 64,019 | 78,200 |
| 2001 | 197,630 | 235,752 |
| 2002 | 335,943 | 393,868 |
| 2003 | 73,388 | 84,249 |
| 2004 | 40,514 | 45,211 |
| 2005 | 129,642 | 140,099 |
| 2006 | 20,470 | 21,431 |
| 2007 | 68,921 | 70,264 |
| 2008 | 1,137,568 | 1,137,568 |
Source: see BankruptcyData