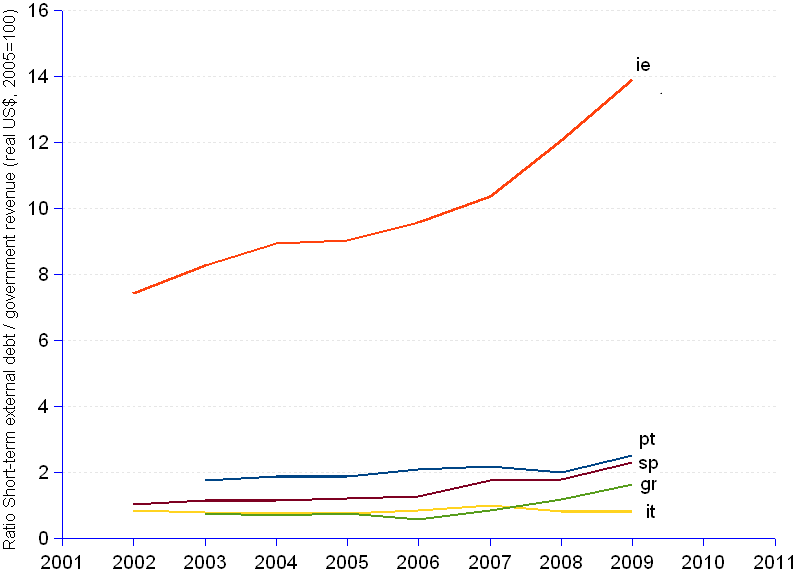
A country's liquidity may be assessed by the proportion of short term external debt that can be covered by its international reserves — we have seen that PIIGS have a low coverage rate — and by the ability to meet short term external debt, defined as debt that has an original maturity of one year or less, with its annual fiscal revenue.
As the chart shows, up to 2009, with the exception of Italy, PIIGS are short on generating enough annual taxes to pay short term debt. In spite of significant tax increases, at average annual rates of 5.4% and 5.6% for Portugal and Spain, 6.5% and 6.6% for Italy and Ireland, and 8.3% for Greece, implying the doubling of fiscal burdens between 9 and 13 years following the case, the fact is that this indicator has been increasing over time, indicating that the country may have budgetary problems in servicing its debt.
Comparable data available for government revenue stops at 2009. However, since 2008 all PIIGS suffered from a contraction of GDP in real US dollars (2005=100) at rates varying from -6% to -11%. Under such circumstances, increases in tax and other mandatory contributions that governments may have imposed on their populations with a view to increase their annual revenue, are likely insufficient to achieve much more than compensate for the serious loss of the tax base that is GDP. In fact it is known that, at least in some countries of the PIIGS area, the combination of a recessive economy, a slowdown of trade, mounting unemployment, cuts of salaries, wages and social benefits, and a significant contraction of consumption have driven revenue from taxes significantly down, while external debt keeps growing.
The net result is a foreseeable ongoing deterioration of the indicator. It is consensual that a debt to tax ratio performs extremely well in predicting the risk of a debt crisis, the threshold having been placed at 300% (or a ratio of 3). By now, the majority of, maybe all PIIGS have likely, if not reached and overtaken the 300% alarm threshold, at least not remained far below. The debt crisis is the current reality.
The consequences are gloomy. Risky debtors command higher interest rates, and parsimonious credit. This is not what the PIIGS need. When GDP growth slows down and exports fall to the ground, countries need abundant and cheap credit to stimulate the economy, foster full employment, encourage consumption, and generate more fiscal revenue from higher domestic income, not from higher tax rates. But the customary government response is to slash social benefits for the needed, keep taxes rising for the lower income brackets, freeze salaries and wages for those who earn a living from their work, and mercilessly strangle people's hope for better tomorrows.
PIIGS have reached this stage, and should brace themselves for an expected long, arduous and painfully demanding crossing of the forthcoming economic desert.
Ratio of Short Term External Debt to Government Revenue | |||||||||||||||
Year¹ |
Portugal |
Ireland |
Italy |
Greece |
Spain |
||||||||||
| Short term external debt ² | Gvt revenue ² | Short term external debt/ |
Short term external debt ² | Gvt revenue ² | Short term external debt/ |
Short term external debt ² | Gvt revenue ² | Short term external debt/ |
Short term external debt ² | Gvt revenue ² | Short term external debt/ |
Short term external debt ² | Gvt revenue ² | Short term external debt/ |
|
| 2002 | 51.0 | 298.5 | 40.2 | 7.4 | 397.2 | 478.8 | 0.83 | 62.5 | 206.2 | 204.3 | 1.0 | ||||
| 2003 | 111.6 | 63.6 | 1.8 | 421.6 | 50.9 | 8.3 | 454.8 | 579.3 | 0.79 | 57.7 | 78.1 | 0.74 | 287.6 | 250.1 | 1.2 |
| 2004 | 133.3 | 71.6 | 1.9 | 541.4 | 60.6 | 8.9 | 471.5 | 637.0 | 0.74 | 59.8 | 87.7 | 0.68 | 312.9 | 276.8 | 1.1 |
| 2005 | 128.1 | 68.9 | 1.9 | 599.2 | 66.4 | 9.0 | 469.5 | 628.5 | 0.75 | 67.1 | 90.7 | 0.74 | 356.7 | 295.9 | 1.2 |
| 2006 | 145.9 | 70.7 | 2.1 | 710.9 | 74.3 | 9.6 | 559.4 | 666.0 | 0.84 | 55.2 | 97.5 | 0.57 | 405.2 | 321.9 | 1.3 |
| 2007 | 173.2 | 79.5 | 2.2 | 852.0 | 82.3 | 10.4 | 736.1 | 748.9 | 0.98 | 94.5 | 113.0 | 0.84 | 656.0 | 375.3 | 1.7 |
| 2008 | 166.0 | 84.0 | 2.0 | 948.7 | 78.7 | 12.1 | 630.2 | 795.3 | 0.79 | 143.3 | 122.3 | 1.17 | 642.0 | 361.1 | 1.8 |
| 2009 | 183.8 | 73.8 | 2.5 | 876.7 | 63.0 | 13.9 | 597.4 | 742.8 | 0.80 | 175.7 | 109.1 | 1.61 | 681.6 | 298.9 | 2.3 |
| 2010 | 204.8 | 680.3 | 523.5 | 220.8 | 657.7 | ||||||||||
| 2011 | 180.7 | 592.0 | 604.7 | 233.2 | 687.3 | ||||||||||
| Avge annual change rate | 6.2% | 5.4% | 6.0% | 7.9% | 6.6% | 9.4% | 4.8% | 6.5% | -0.4% | 19.1% | 8.3% | 13.9% | 14.3% | 5.6% | 12.4% |
| ¹ All years show 4th Quarter values, except 2011 that is 3rd Quarter. | |||||||||||||||
| ² Billion real US$, 2005=100. | |||||||||||||||
Sources: JEDH for external debt, and World DataBank for government revenue estimates.